- Home >
- Stock Photos >
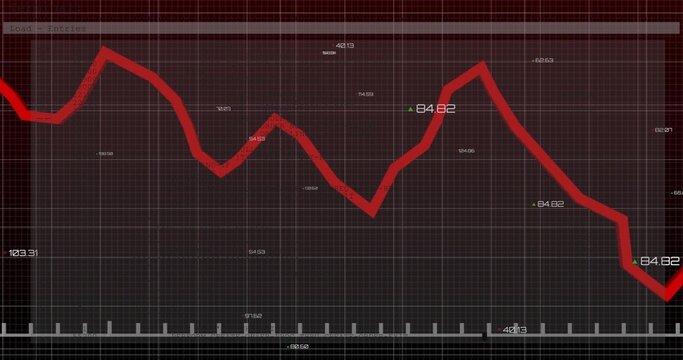
- Red Trend Line Fluctuating on Digital Chart Grid
Red Trend Line Fluctuating on Digital Chart Grid Image

Red trend line fluctuating on digital chart grid depicting market trends, financial analysis, and data visualization. Ideal for illustrating concepts in financial reports, economic assessments, investment strategy reviews, and presentations focused on economic analytics and business forecasting.
Powered by 


0
downloads
downloads
Tags:
More
Credit Photo
If you would like to credit the Photo, here are some ways you can do so
Text Link
photo Link
<span class="text-link">
<span>
<a target="_blank" href=https://pikwizard.com/photo/red-trend-line-fluctuating-on-digital-chart-grid/897208336af1e2454f92eb6ff95a6aa9/>PikWizard</a>
</span>
</span>
<span class="image-link">
<span
style="margin: 0 0 20px 0; display: inline-block; vertical-align: middle; width: 100%;"
>
<a
target="_blank"
href="https://pikwizard.com/photo/red-trend-line-fluctuating-on-digital-chart-grid/897208336af1e2454f92eb6ff95a6aa9/"
style="text-decoration: none; font-size: 10px; margin: 0;"
>
<img src="https://pikwizard.com/pw/medium/897208336af1e2454f92eb6ff95a6aa9.jpg" style="margin: 0; width: 100%;" alt="" />
<p style="font-size: 12px; margin: 0;">PikWizard</p>
</a>
</span>
</span>
Free (free of charge)
Free for personal and commercial use.
Author: Authentic Images
Similar Free Stock Images

Premium


Premium


Premium


Premium


Premium


Premium


Premium


Premium


Premium


Premium


Premium


Premium


Premium


Premium


Premium


Premium


Premium


Premium


Premium


Premium


Premium


Premium


Premium


Premium