
- Home >
- Stock Photos >
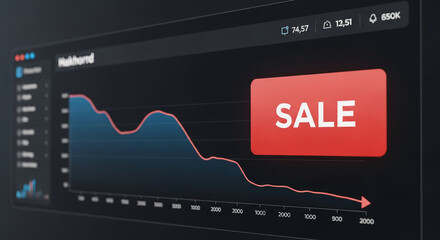
- Red Trend Line on Data Analytics Dashboard with Code Overlay
Red Trend Line on Data Analytics Dashboard with Code Overlay Image

This dynamic design showcases a red jagged trend line against a dark gridded background, blending financial chart elements with clusters of text code, representing complex data processing. It is ideal for use in presentations or websites focused on digital analytics, data science, technology education, financial trends, or high-tech corporate contexts.
Powered by 


downloads
Tags:
More
Credit Photo
If you would like to credit the Photo, here are some ways you can do so
Text Link
photo Link
<span class="text-link">
<span>
<a target="_blank" href=https://pikwizard.com/photo/red-trend-line-on-data-analytics-dashboard-with-code-overlay/e446121bc0f665568ac714fe0ca325a6/>PikWizard</a>
</span>
</span>
<span class="image-link">
<span
style="margin: 0 0 20px 0; display: inline-block; vertical-align: middle; width: 100%;"
>
<a
target="_blank"
href="https://pikwizard.com/photo/red-trend-line-on-data-analytics-dashboard-with-code-overlay/e446121bc0f665568ac714fe0ca325a6/"
style="text-decoration: none; font-size: 10px; margin: 0;"
>
<img src="https://pikwizard.com/pw/medium/e446121bc0f665568ac714fe0ca325a6.jpg" style="margin: 0; width: 100%;" alt="" />
<p style="font-size: 12px; margin: 0;">PikWizard</p>
</a>
</span>
</span>
Free (free of charge)
Free for personal and commercial use.
Author: Awesome Content
Similar Free Stock Images

Premium


Premium

Premium


Premium


Premium


Premium


Premium


Premium


Premium


Premium

Premium


Premium


Premium


Premium


Premium

Premium


Premium

Premium


Premium


Premium


Premium


Premium


Premium


Premium


Premium
Explore More Free Stock Images