
- Home >
- Stock Photos >
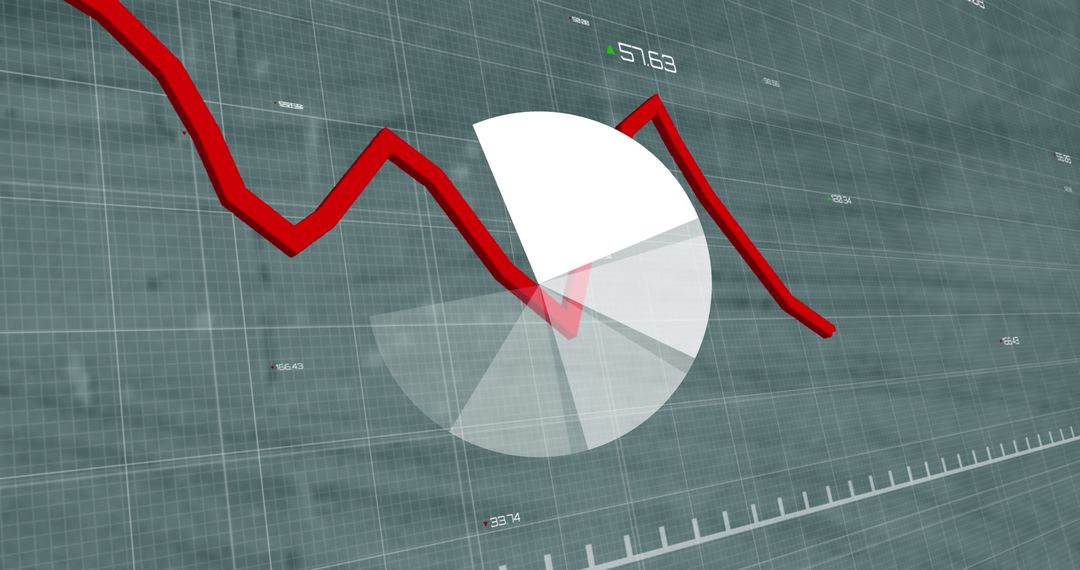
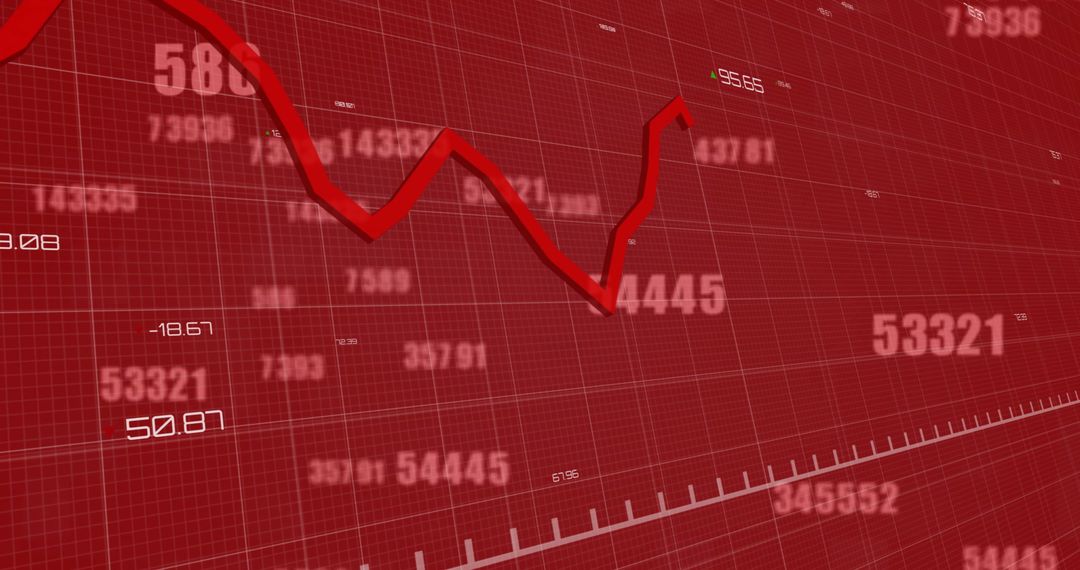
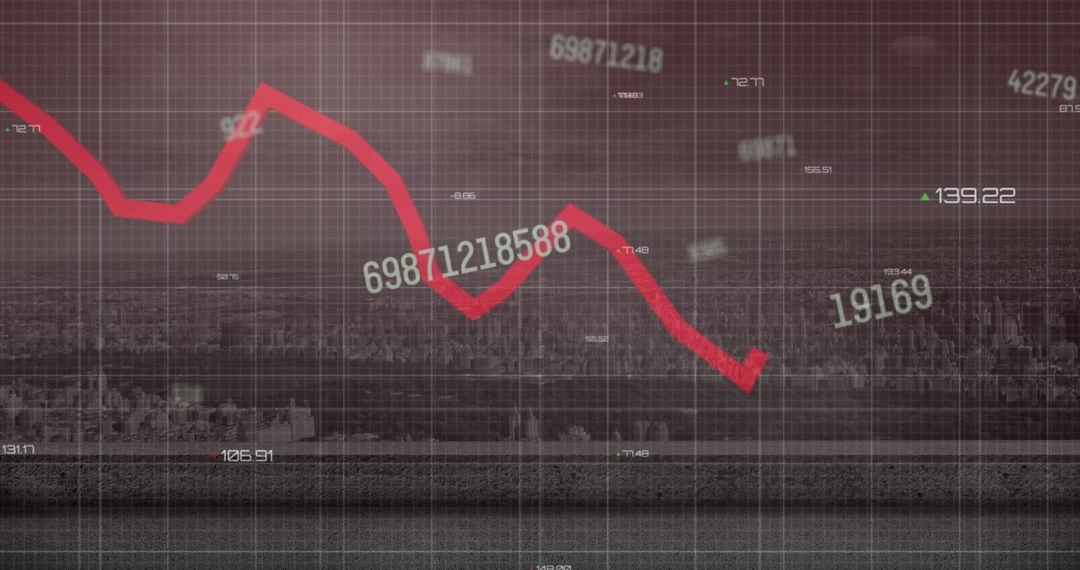
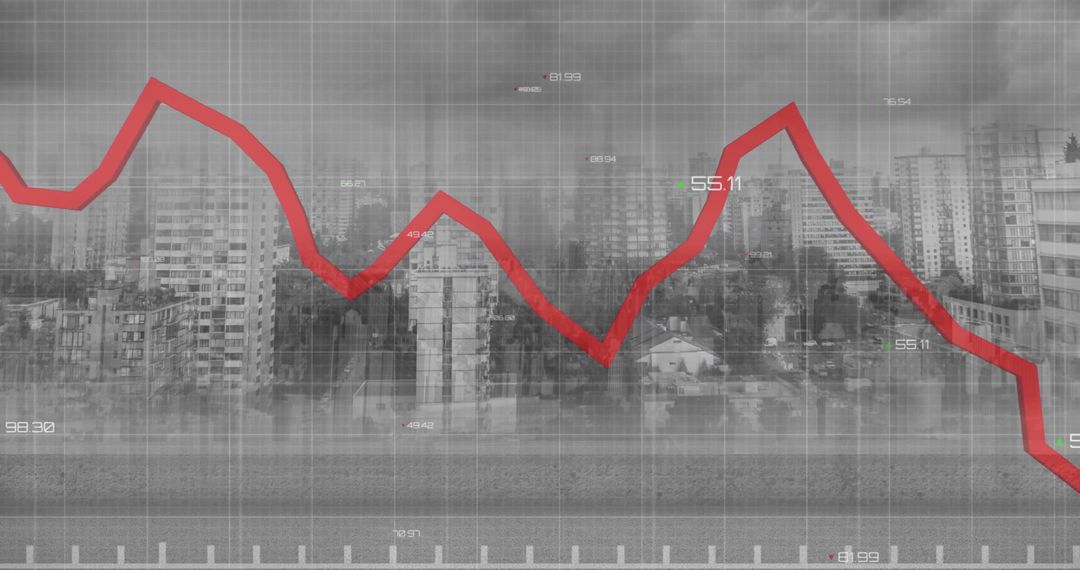
- Red up and down financial graph on grey digital background
Red up and down financial graph on grey digital background Image

Red line graph overlaid on grey digital data represents fluctuations in financial or stock market trends. Suitable for illustrating economic reports, digital analytics discussions, trading tutorials, or building premium website backgrounds focused on finance and economy.
Powered by  - Get 15% off with code: PIKWIZARD15


2
downloads
downloads
Tags:
More
Credit Photo
If you would like to credit the Photo, here are some ways you can do so
Text Link
photo Link
<span class="text-link">
<span>
<a target="_blank" href=https://pikwizard.com/photo/red-up-and-down-financial-graph-on-grey-digital-background/3dd1758845cd61704de483dfb854699a/>PikWizard</a>
</span>
</span>
<span class="image-link">
<span
style="margin: 0 0 20px 0; display: inline-block; vertical-align: middle; width: 100%;"
>
<a
target="_blank"
href="https://pikwizard.com/photo/red-up-and-down-financial-graph-on-grey-digital-background/3dd1758845cd61704de483dfb854699a/"
style="text-decoration: none; font-size: 10px; margin: 0;"
>
<img src="https://pikwizard.com/pw/medium/3dd1758845cd61704de483dfb854699a.jpg" style="margin: 0; width: 100%;" alt="" />
<p style="font-size: 12px; margin: 0;">PikWizard</p>
</a>
</span>
</span>
Free (free of charge)
Free for personal and commercial use.
Author: People Creations
Similar Free Stock Images

Premium


Premium


Premium


Premium


Premium


Premium


Premium


Premium


Premium


Premium


Premium


Premium


Premium


Premium


Premium


Premium


Premium


Premium


Premium


Premium


Premium


Premium


Premium


Premium

