- Home >
- Stock Photos >
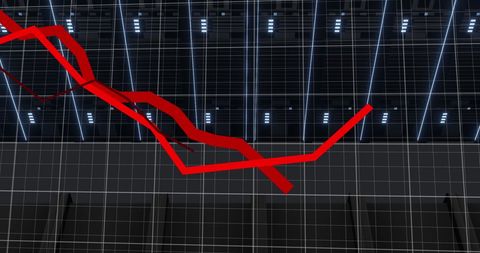
- Red Zigzag Trend Lines Crossing Dark Binary Grid Representing Financial Data Fluctuations
Red Zigzag Trend Lines Crossing Dark Binary Grid Representing Financial Data Fluctuations Image

Depicting thick red zigzag and thin red trend lines crossing dark navy grid with floating binary digits, evoking market fluctuation and algorithmic trading. Working well for financial reports, market analysis slides, fintech websites, blog headers, investment presentations. Helping illustrate market downturns, recovery phases, volatility metrics, algorithmic strategies, risk analysis, performance dashboards. Allowing text overlay for headlines, data labels, or callouts on empty grid areas. Fitting for print and digital use including reports, social media posts, slide decks, website banners, and editorial layouts.

downloads
Credit Photo
If you would like to credit the Photo, here are some ways you can do so
Free (free of charge)
Free for personal and commercial use.
Author: Awesome Content