- Home >
- Stock Photos >
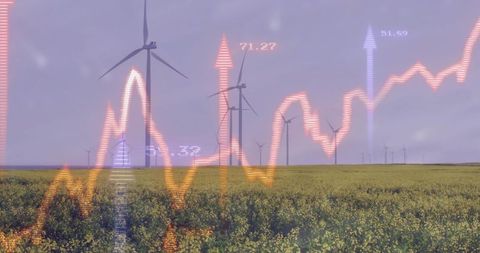
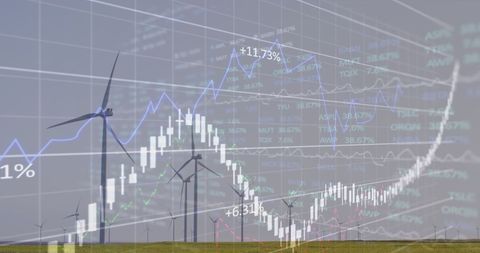
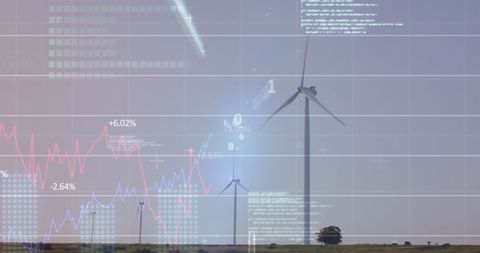
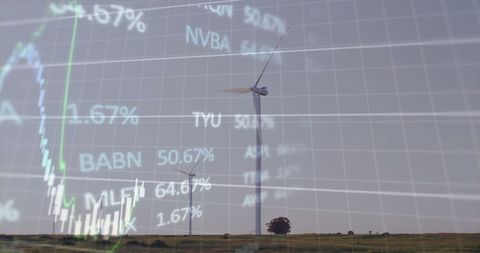
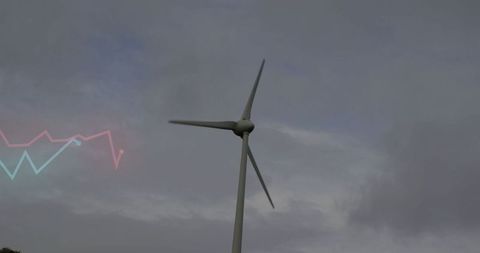
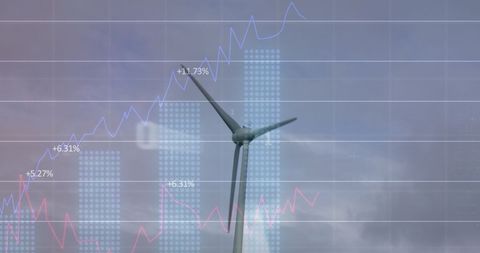
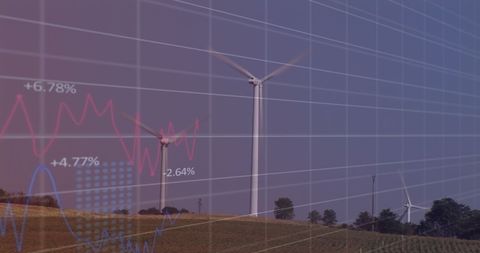
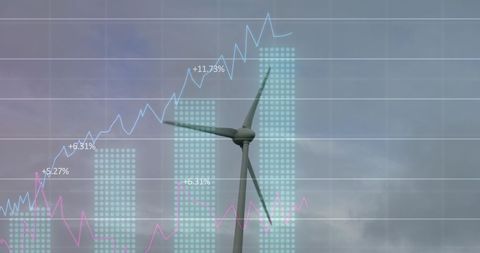
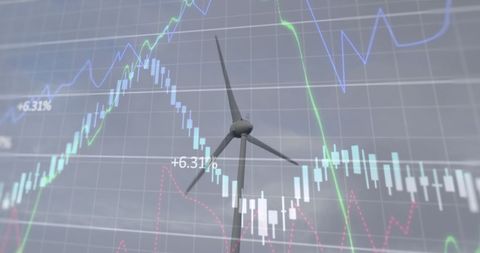
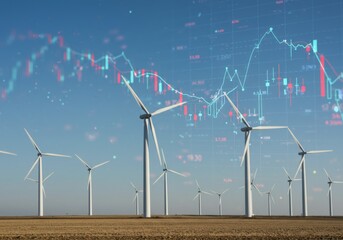
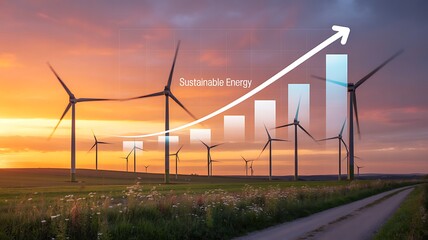
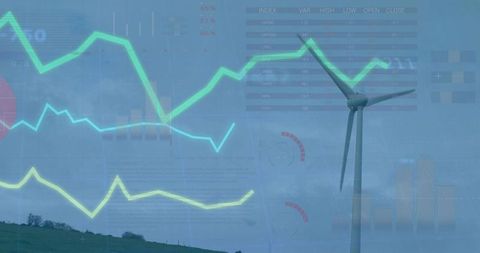
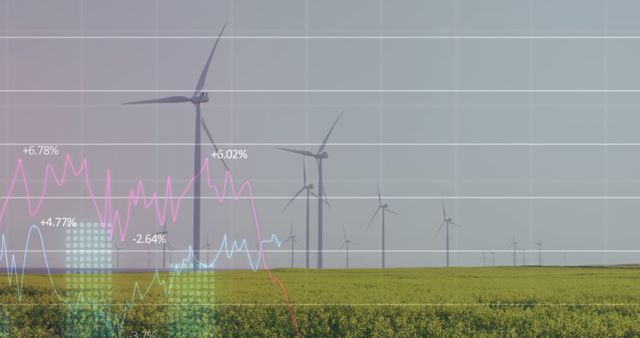
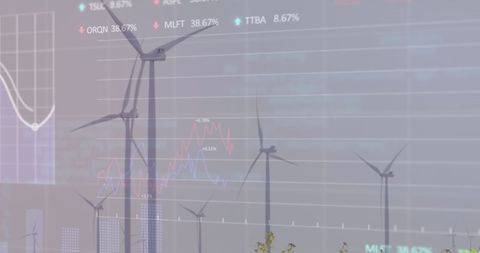
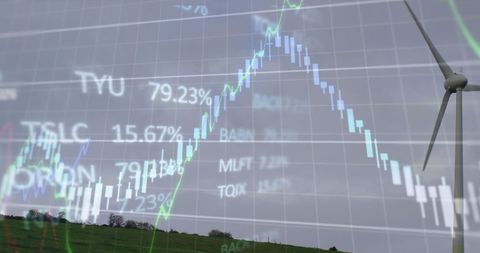
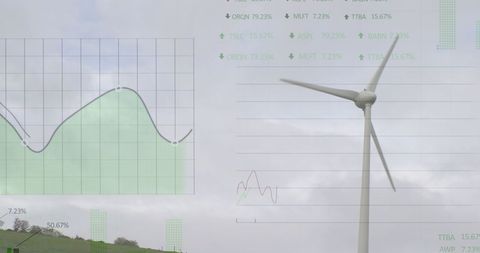
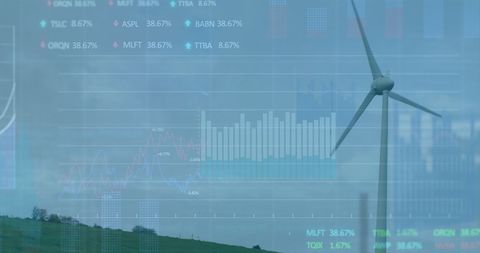
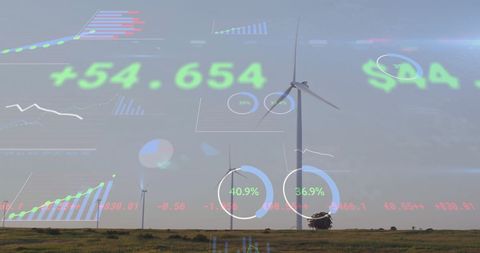
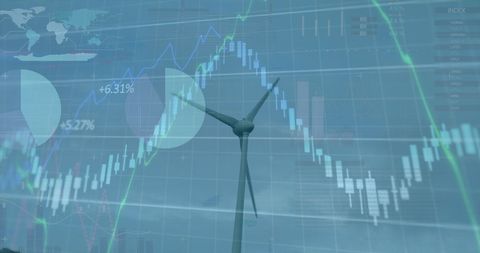
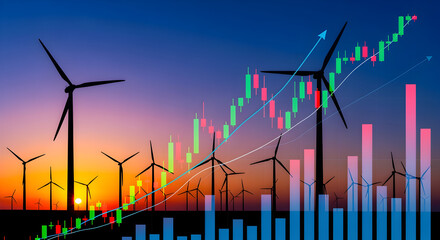
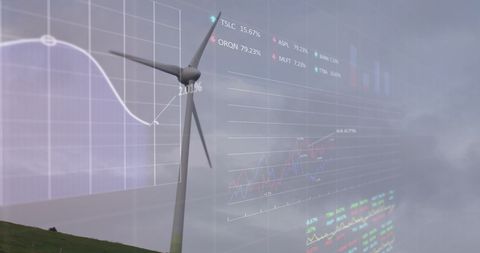
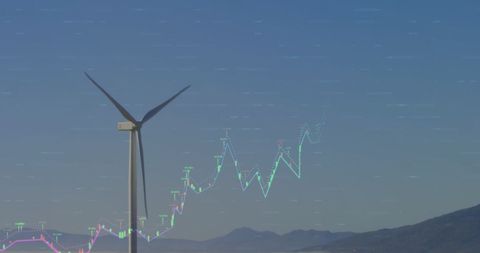
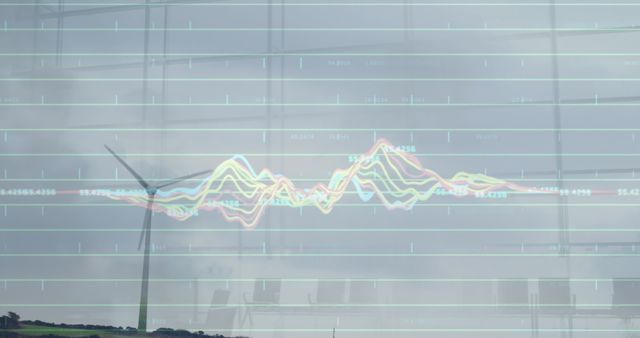
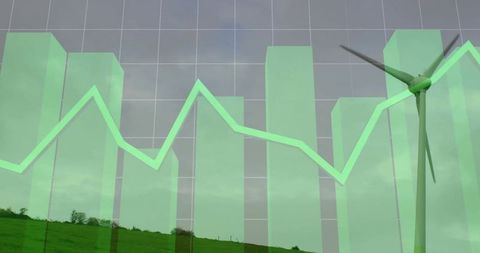
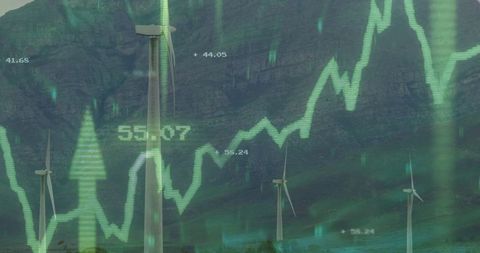
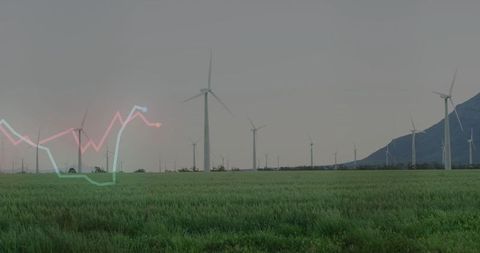
- Renewable Energy Financial Graph Investment Visualization
Renewable Energy Financial Graph Investment Visualization Image
A wind turbine superimposed with fluctuating financial chart symbolizes bridging renewable energy with financial analysis, ideal for illustrating sustainable investment, energy market trends, and economic projections in renewable sectors. Useful in articles discussing clean energy finance or presentations about sustainable growth investments.
Powered by 


2
downloads
downloads
Tags:
More
Credit Photo
If you would like to credit the Photo, here are some ways you can do so
Text Link
photo Link
<span class="text-link">
<span>
<a target="_blank" href=https://pikwizard.com/photo/renewable-energy-financial-graph-investment-visualization/d1a942967df829cafb4ee3422491b6fd/>PikWizard</a>
</span>
</span>
<span class="image-link">
<span
style="margin: 0 0 20px 0; display: inline-block; vertical-align: middle; width: 100%;"
>
<a
target="_blank"
href="https://pikwizard.com/photo/renewable-energy-financial-graph-investment-visualization/d1a942967df829cafb4ee3422491b6fd/"
style="text-decoration: none; font-size: 10px; margin: 0;"
>
<img src="https://pikwizard.com/pw/medium/d1a942967df829cafb4ee3422491b6fd.jpg" style="margin: 0; width: 100%;" alt="" />
<p style="font-size: 12px; margin: 0;">PikWizard</p>
</a>
</span>
</span>
Free (free of charge)
Free for personal and commercial use.
Author: Awesome Content
Similar Free Stock Images
Premium


Premium


Premium

Premium


Premium

Premium

Premium

Premium


Premium

Premium


Premium


Premium


Premium


Premium

Premium


Premium

Premium


Premium


Premium

Premium


Premium


Premium


Premium


Premium


Premium