- Home >
- Stock Photos >
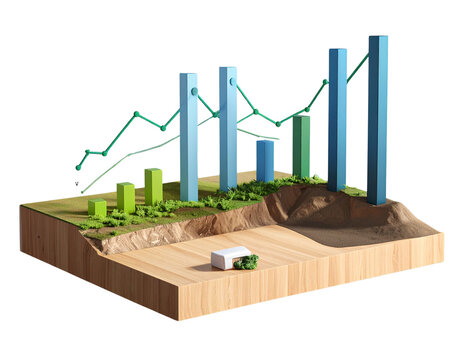
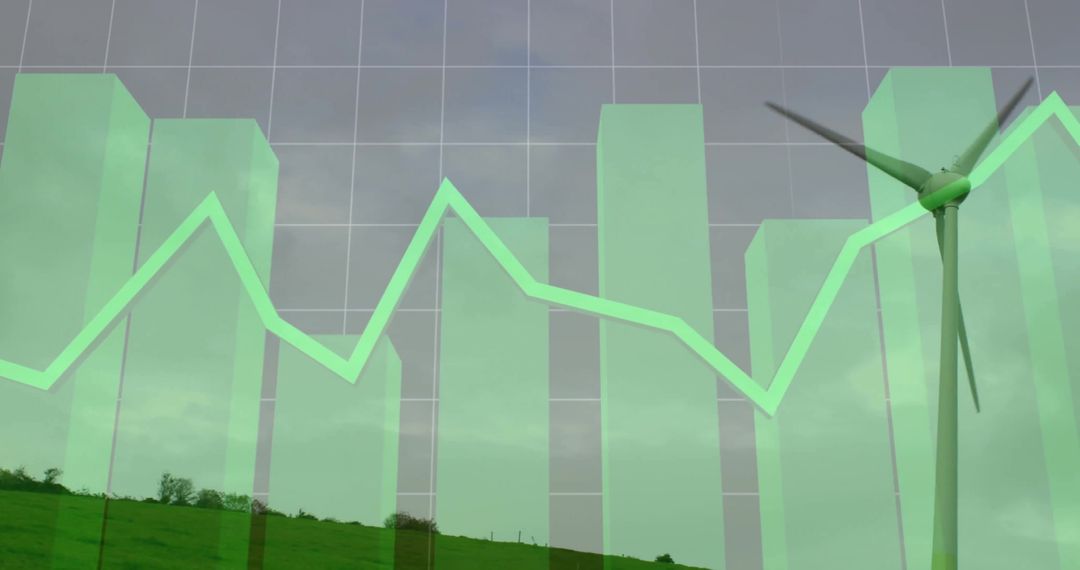
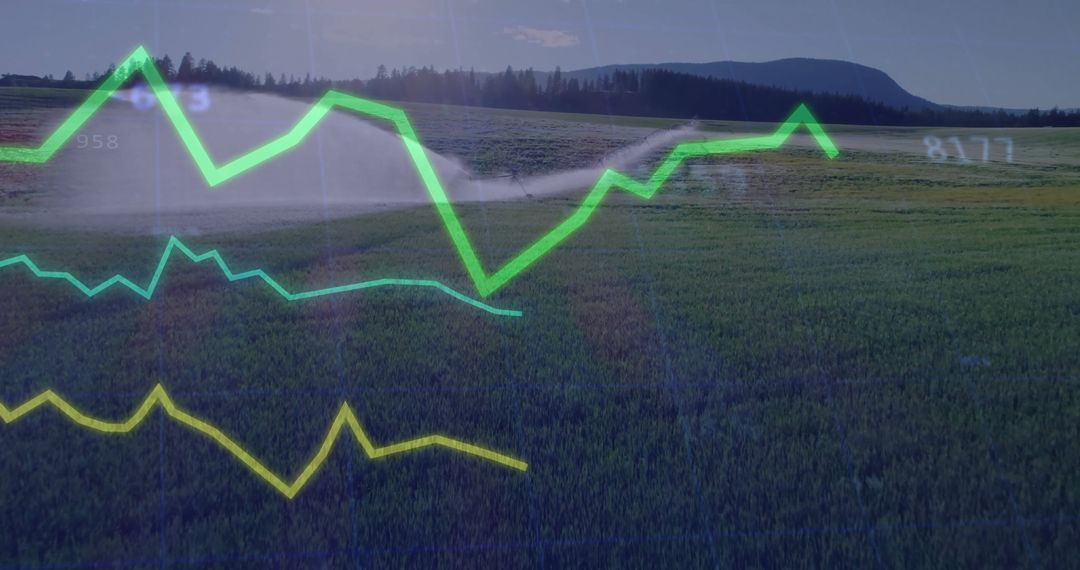
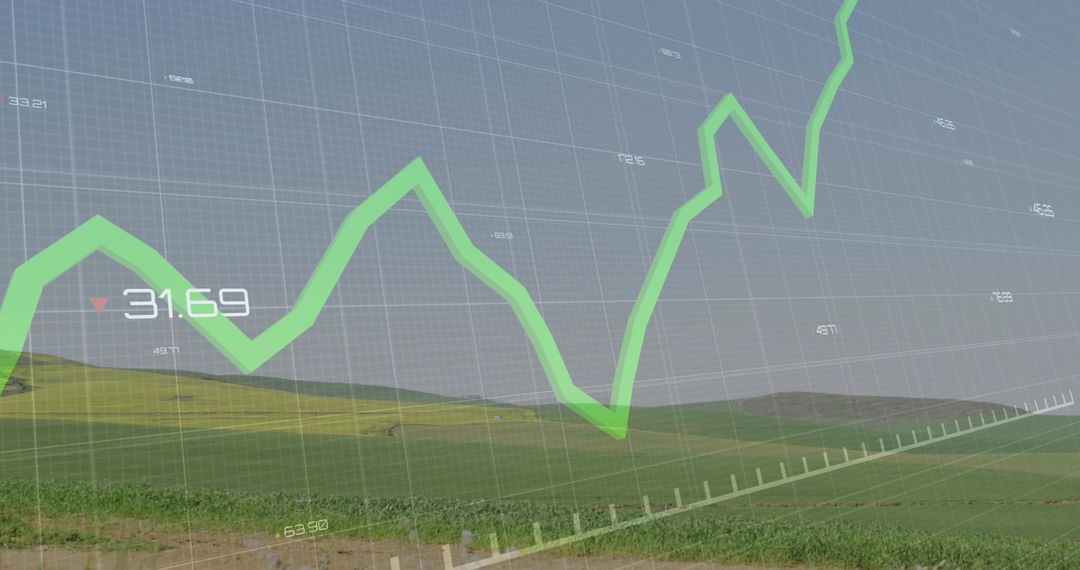
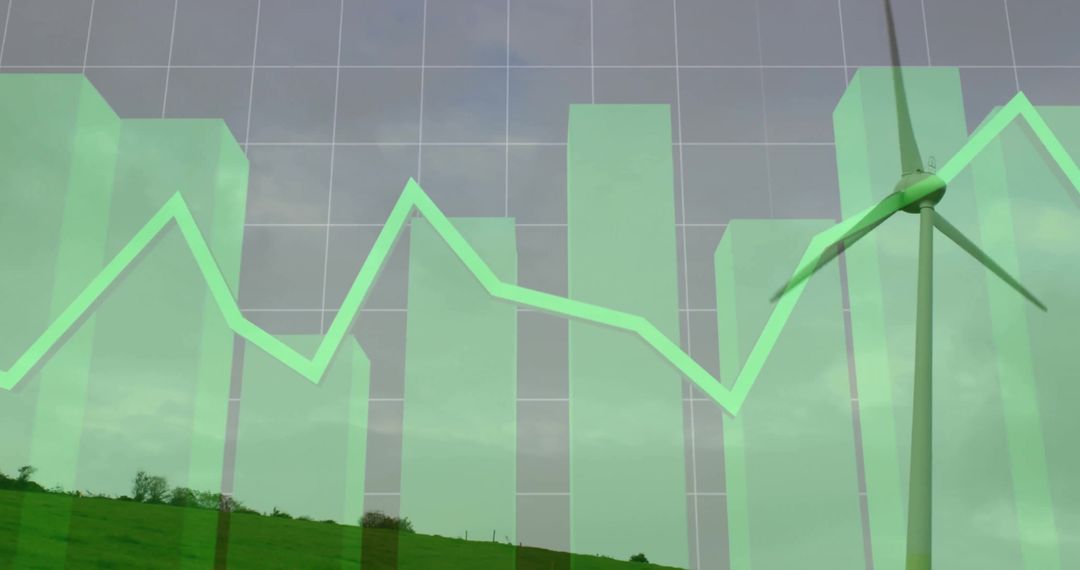
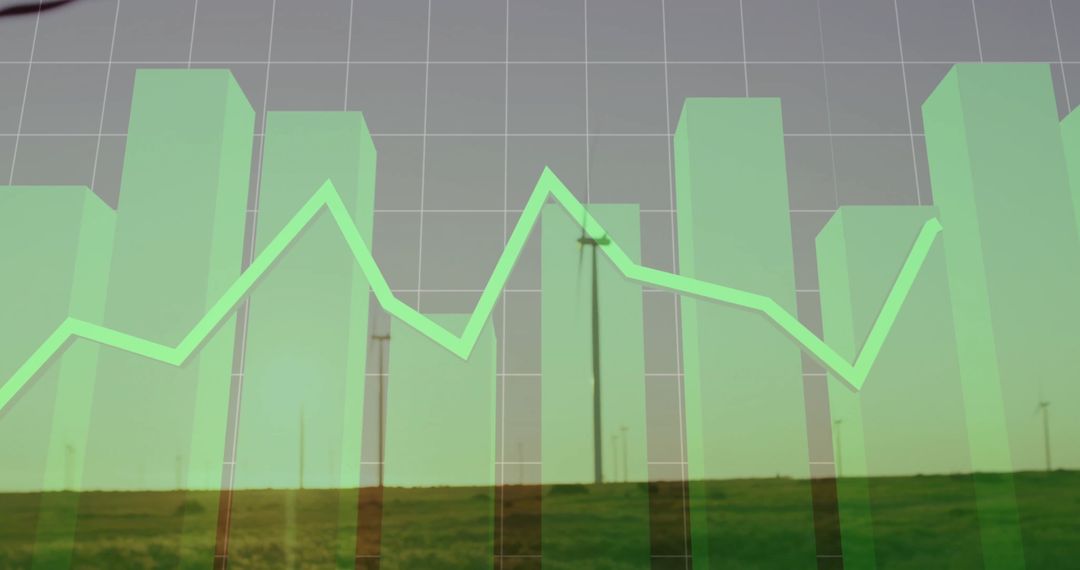
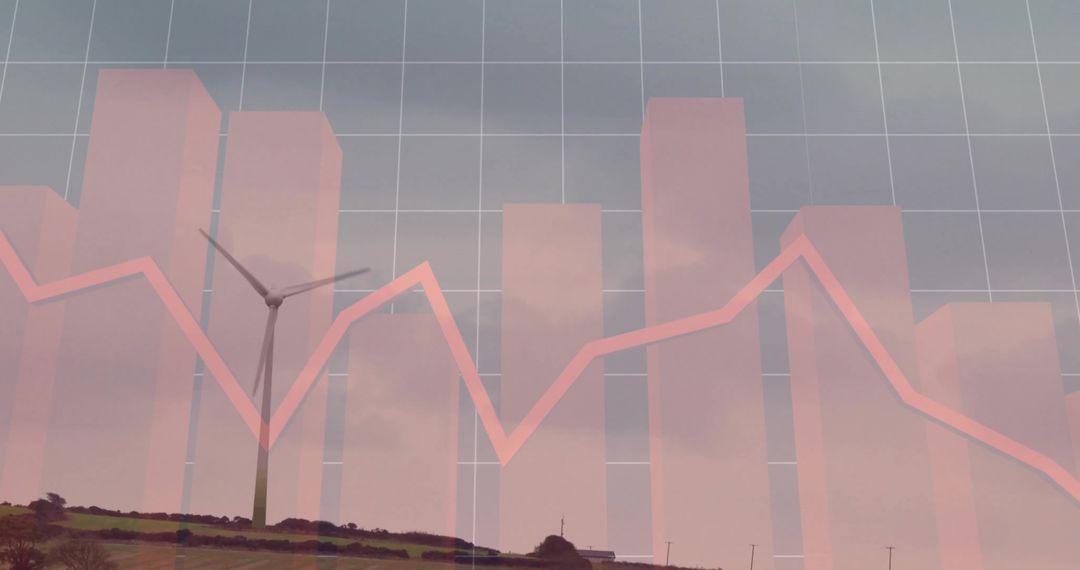
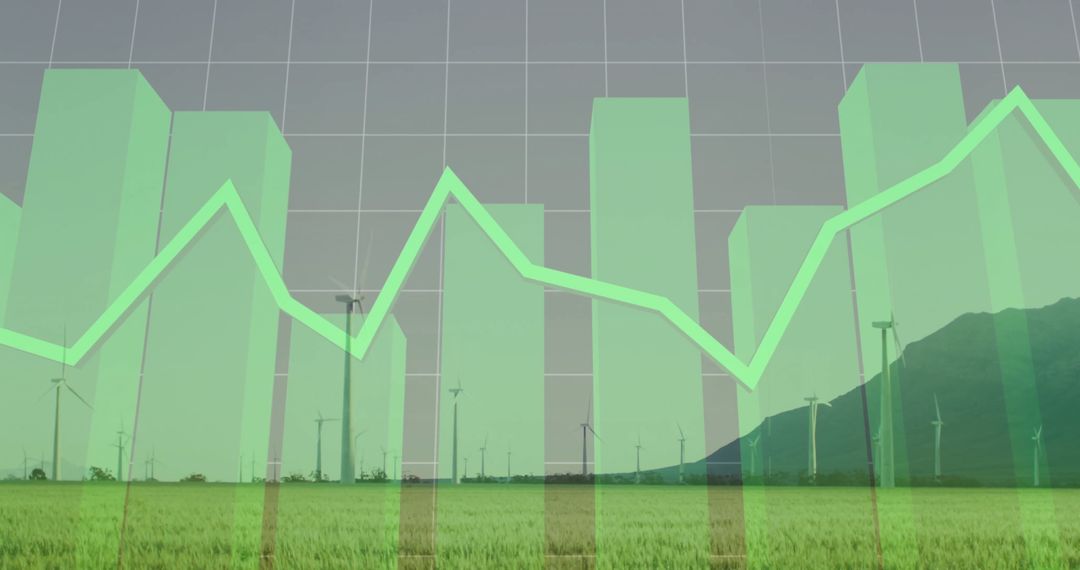
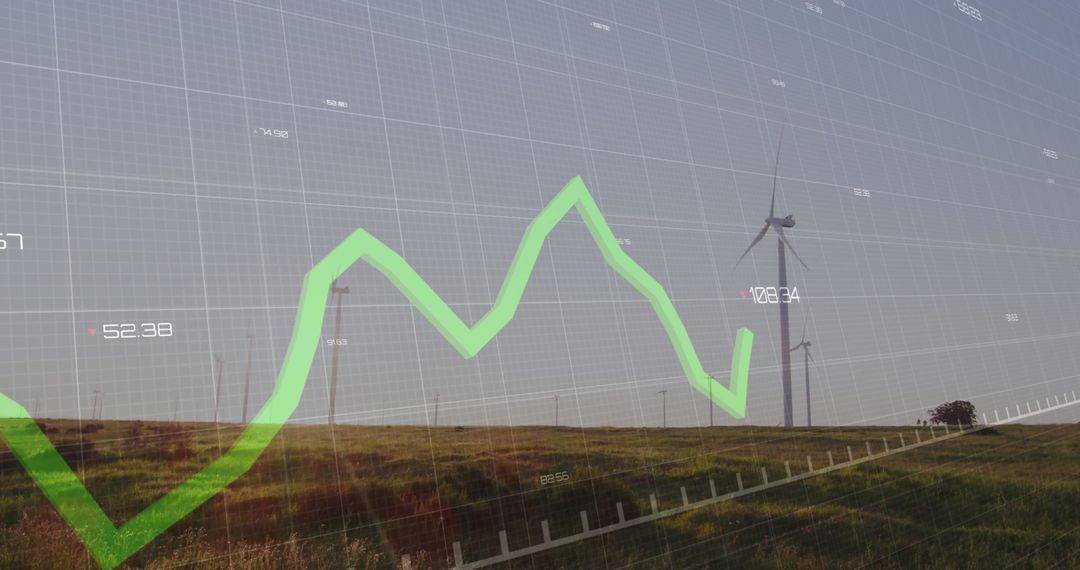
- Renewable Energy Statistics Overlaid on Grass Field
Renewable Energy Statistics Overlaid on Grass Field Image

The image illustratively combines complex data representations like bar and line graphs with a backdrop of a rural grassy field and wind turbines, symbolizing the intersection of technology, finance, and sustainability in renewable energy sectors. Useful for projects related to sustainability reports, presentations on energy statistics, environmental campaigns or investment insights in green energy.
Powered by 


0
downloads
downloads
Tags:
More
Credit Photo
If you would like to credit the Photo, here are some ways you can do so
Text Link
photo Link
<span class="text-link">
<span>
<a target="_blank" href=https://pikwizard.com/photo/renewable-energy-statistics-overlaid-on-grass-field/0eba4436f2afebc1e8e8fb70b3cde833/>PikWizard</a>
</span>
</span>
<span class="image-link">
<span
style="margin: 0 0 20px 0; display: inline-block; vertical-align: middle; width: 100%;"
>
<a
target="_blank"
href="https://pikwizard.com/photo/renewable-energy-statistics-overlaid-on-grass-field/0eba4436f2afebc1e8e8fb70b3cde833/"
style="text-decoration: none; font-size: 10px; margin: 0;"
>
<img src="https://pikwizard.com/pw/medium/0eba4436f2afebc1e8e8fb70b3cde833.jpg" style="margin: 0; width: 100%;" alt="" />
<p style="font-size: 12px; margin: 0;">PikWizard</p>
</a>
</span>
</span>
Free (free of charge)
Free for personal and commercial use.
Author: People Creations
Similar Free Stock Images

Premium


Premium


Premium


Premium


Premium

Premium


Premium


Premium


Premium


Premium


Premium


Premium


Premium


Premium


Premium


Premium


Premium


Premium


Premium


Premium


Premium


Premium


Premium


Premium