- Home >
- Stock Photos >
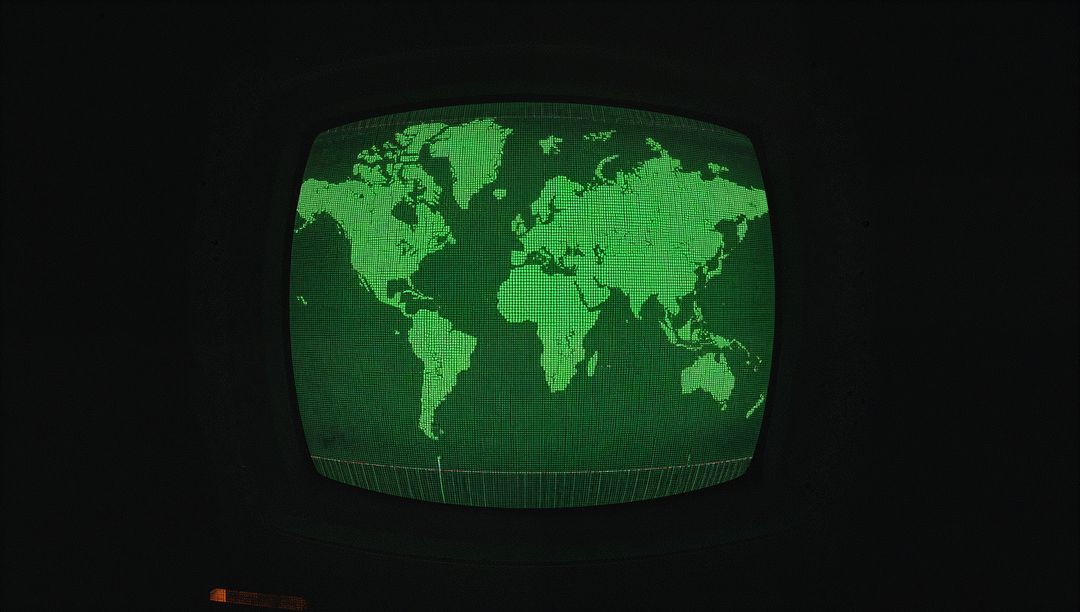
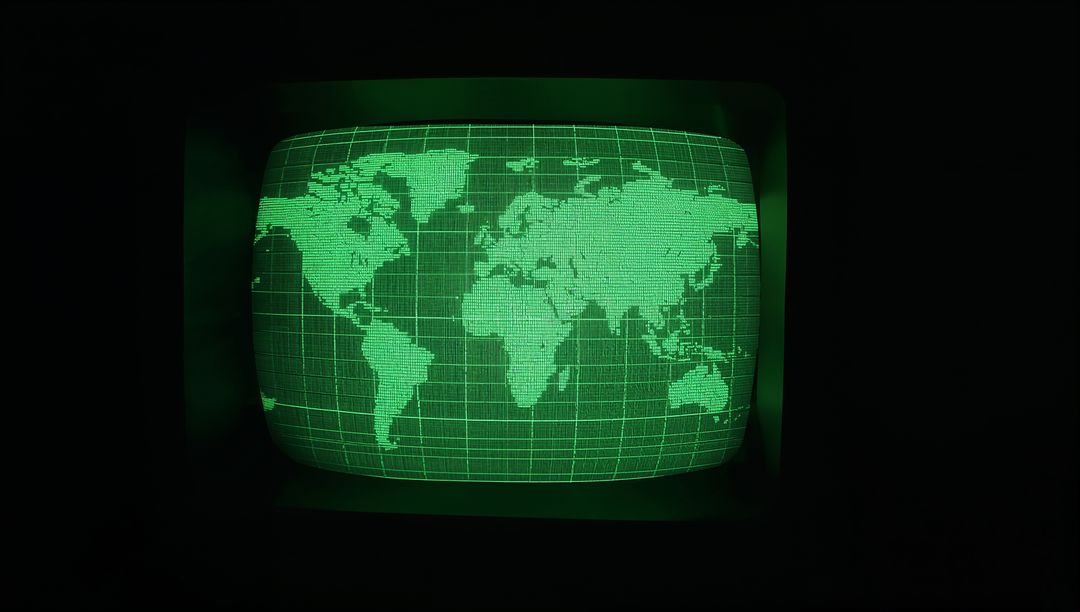
- Retro CRT Display with Green World Map in Technological Environment
Retro CRT Display with Green World Map in Technological Environment Image
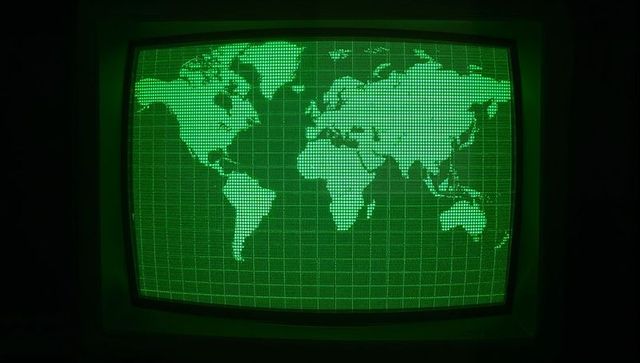
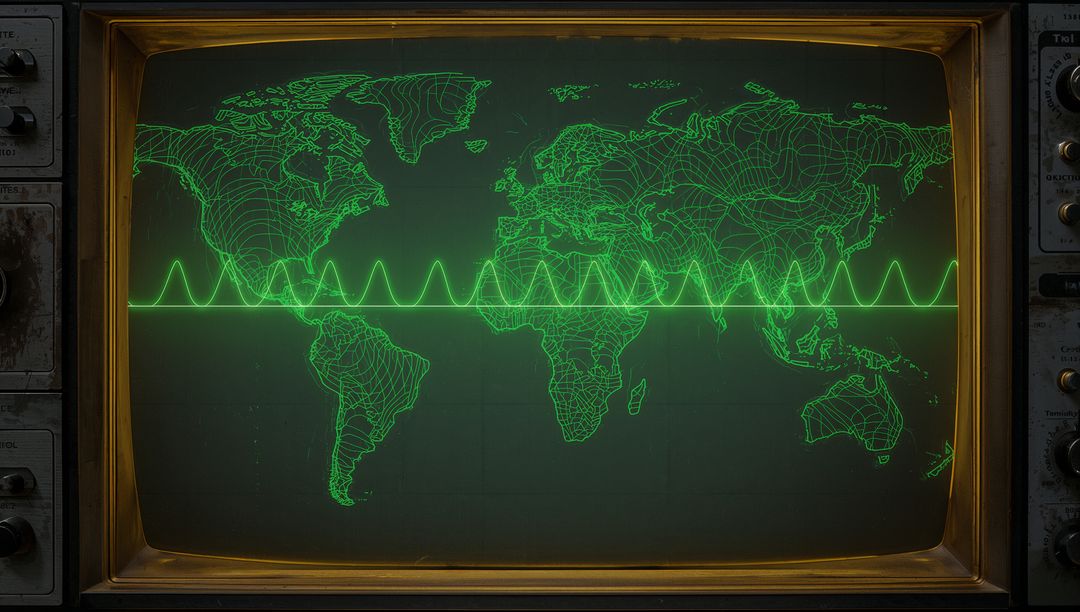
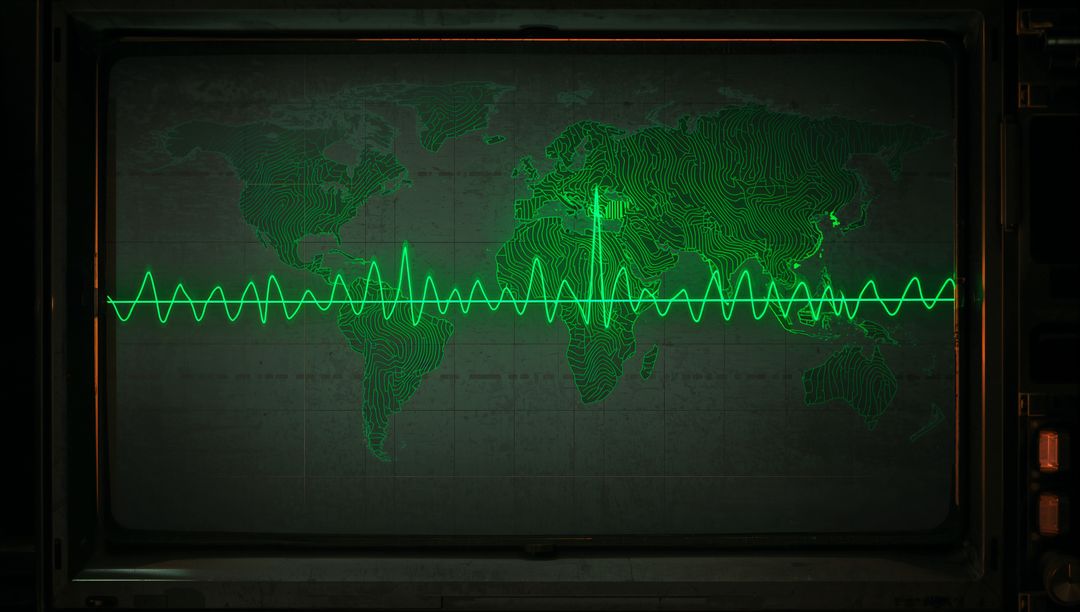
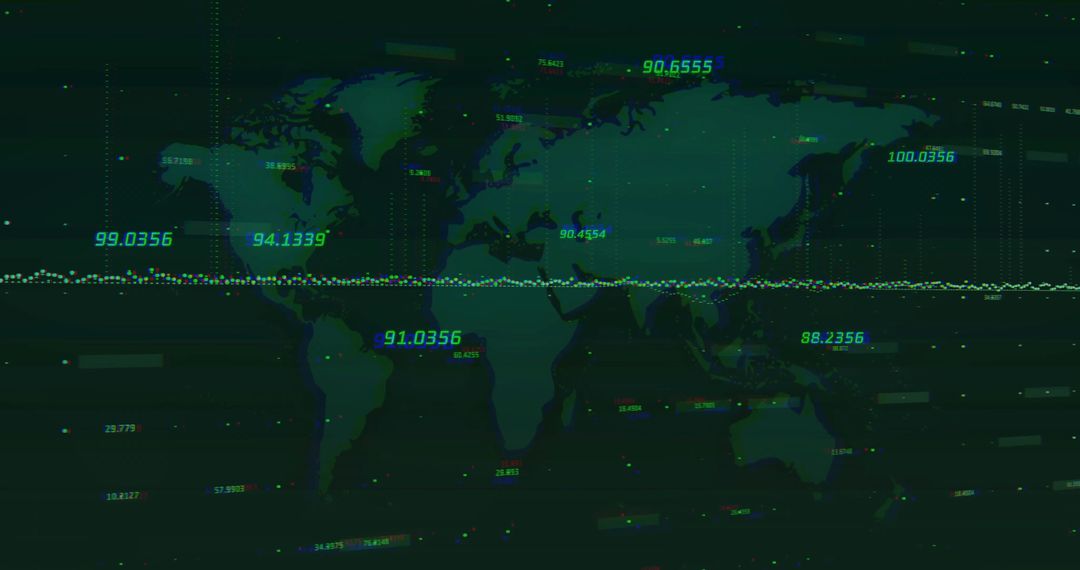
AI Generated Image. CRT monitor is showing a vintage-style world map with a dot matrix effect, enhanced by a vivid green overlay and a clearly visible latitude-longitude grid. Built reminiscent of classic control room themes, this image is perfect for creative technological projects wanting an old-school flair, educational uses in displaying geographical elements, or as decor in themes involving retro tech.
Powered by 


0
downloads
downloads
Tags:
More
Credit Photo
If you would like to credit the Photo, here are some ways you can do so
Text Link
photo Link
<span class="text-link">
<span>
<a target="_blank" href=https://pikwizard.com/photo/retro-crt-display-with-green-world-map-in-technological-environment/4b3b171b6345b9c0f7368ebbfc3d2da1/>PikWizard</a>
</span>
</span>
<span class="image-link">
<span
style="margin: 0 0 20px 0; display: inline-block; vertical-align: middle; width: 100%;"
>
<a
target="_blank"
href="https://pikwizard.com/photo/retro-crt-display-with-green-world-map-in-technological-environment/4b3b171b6345b9c0f7368ebbfc3d2da1/"
style="text-decoration: none; font-size: 10px; margin: 0;"
>
<img src="https://pikwizard.com/pw/medium/4b3b171b6345b9c0f7368ebbfc3d2da1.jpg" style="margin: 0; width: 100%;" alt="" />
<p style="font-size: 12px; margin: 0;">PikWizard</p>
</a>
</span>
</span>
Free (free of charge)
Free for personal and commercial use.
Author: AI Creator
Similar Free Stock Images