- Home >
- Stock Photos >
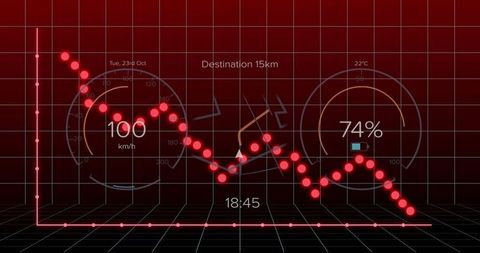
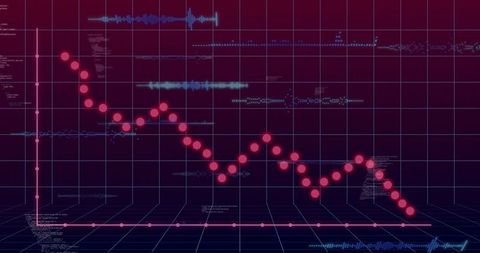
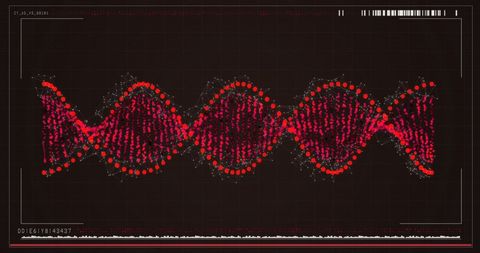
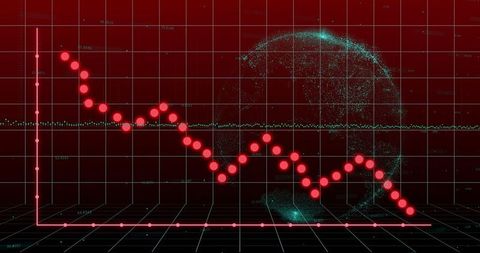
- Retrofuturistic Line Graph Analytics Display with Grid Interface
Retrofuturistic Line Graph Analytics Display with Grid Interface Image
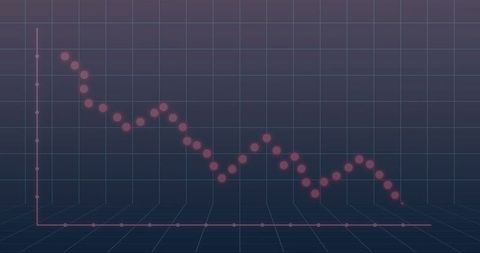
Visual showcases an oscillating line graph displayed on a digital grid. Magenta data points signify variations, creating futuristic ambiance. Suitable for illustrating analytical trends, financial predictions, or tech-driven results in presentations, reports, and educational content.
Powered by  - Get 15% off with code: PIKWIZARD15


downloads
Tags:
More
Credit Photo
If you would like to credit the Photo, here are some ways you can do so
Text Link
photo Link
<span class="text-link">
<span>
<a target="_blank" href=https://pikwizard.com/photo/retrofuturistic-line-graph-analytics-display-with-grid-interface/fd47075b5b89f13f5b4397bd7e2cf4bb/>PikWizard</a>
</span>
</span>
<span class="image-link">
<span
style="margin: 0 0 20px 0; display: inline-block; vertical-align: middle; width: 100%;"
>
<a
target="_blank"
href="https://pikwizard.com/photo/retrofuturistic-line-graph-analytics-display-with-grid-interface/fd47075b5b89f13f5b4397bd7e2cf4bb/"
style="text-decoration: none; font-size: 10px; margin: 0;"
>
<img src="https://pikwizard.com/pw/medium/fd47075b5b89f13f5b4397bd7e2cf4bb.jpg" style="margin: 0; width: 100%;" alt="" />
<p style="font-size: 12px; margin: 0;">PikWizard</p>
</a>
</span>
</span>
Free (free of charge)
Free for personal and commercial use.
Author: People Creations