- Home >
- Stock Photos >
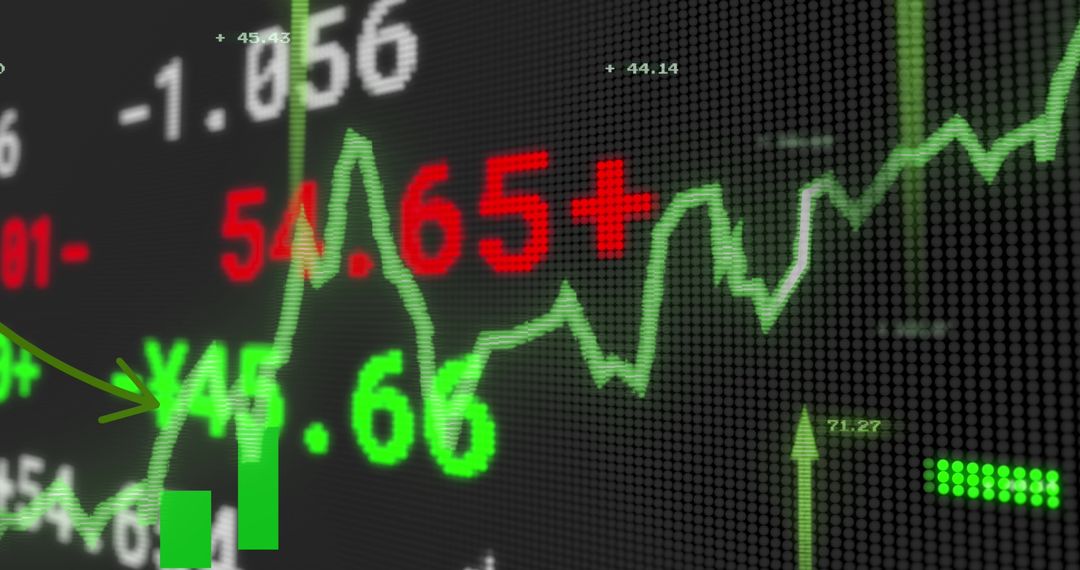
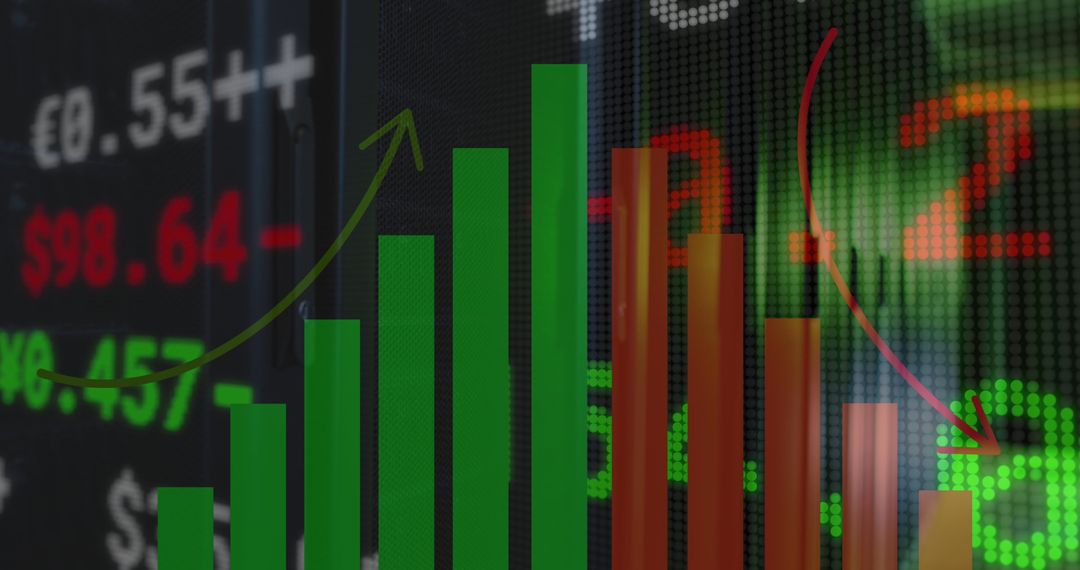
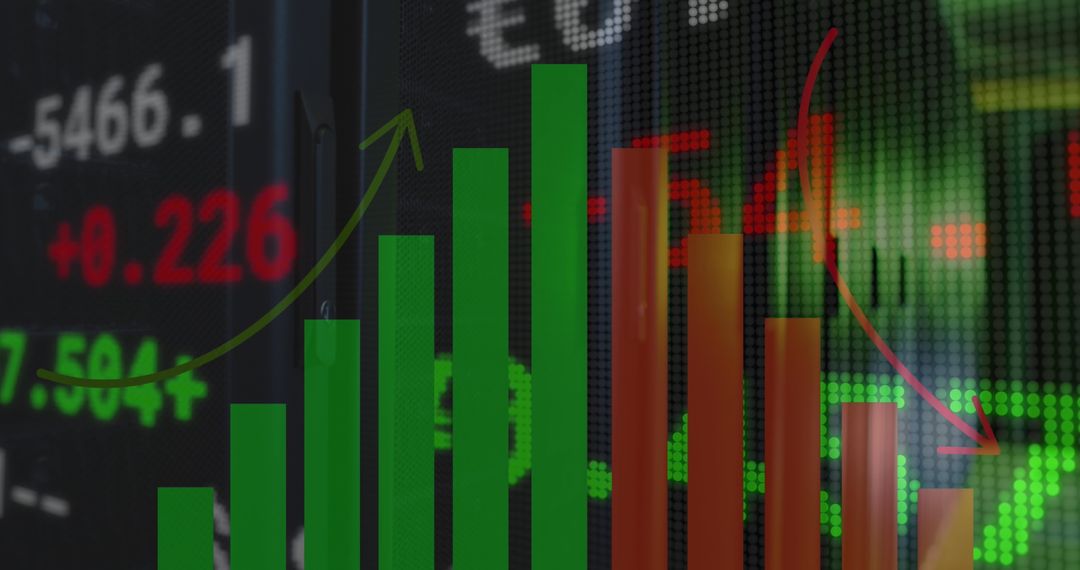
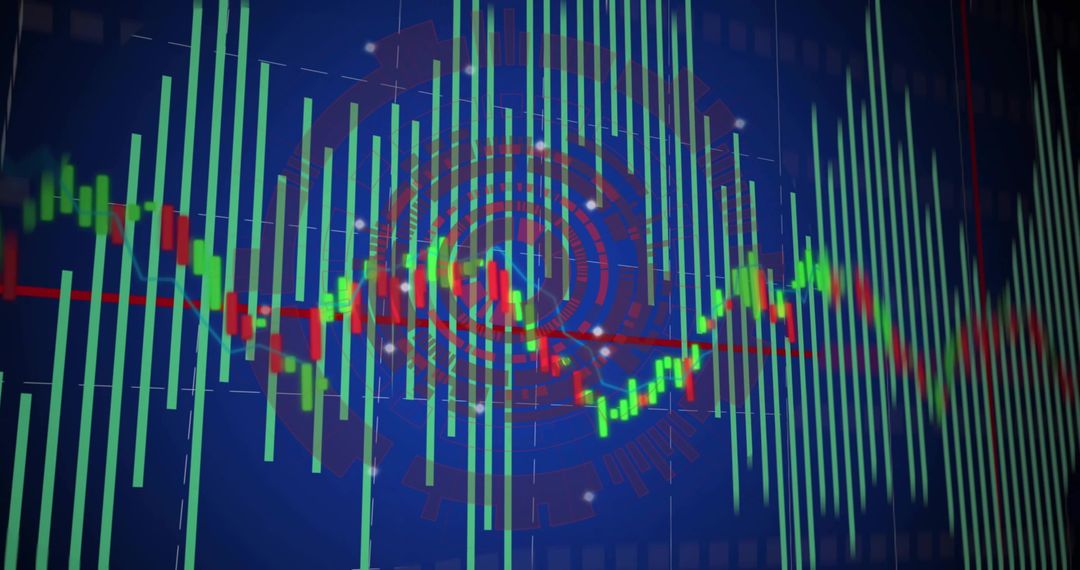
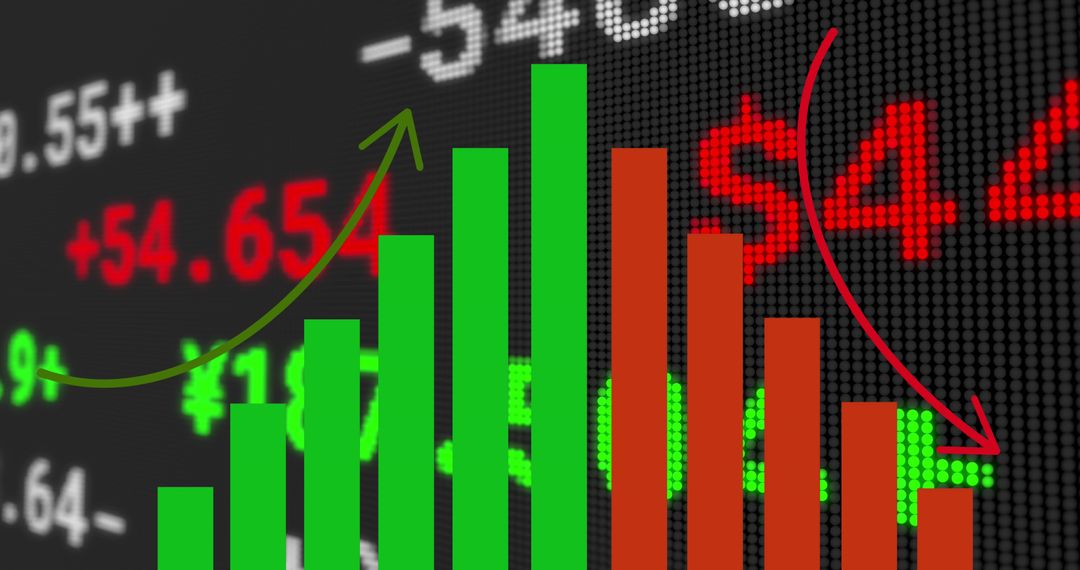
- Rising and Falling Bars on Stock Market Display with Arrows
Rising and Falling Bars on Stock Market Display with Arrows Image

Charts display rising and falling bars in green and red colors with arrows indicating trends. Useful for financial presentations, investment pages, or economic reports showcasing market changes and analysis.
Powered by 


2
downloads
downloads
Tags:
More
Credit Photo
If you would like to credit the Photo, here are some ways you can do so
Text Link
photo Link
<span class="text-link">
<span>
<a target="_blank" href=https://pikwizard.com/photo/rising-and-falling-bars-on-stock-market-display-with-arrows/3a3942ac1af2ae9dac8a6c260d0c9ce2/>PikWizard</a>
</span>
</span>
<span class="image-link">
<span
style="margin: 0 0 20px 0; display: inline-block; vertical-align: middle; width: 100%;"
>
<a
target="_blank"
href="https://pikwizard.com/photo/rising-and-falling-bars-on-stock-market-display-with-arrows/3a3942ac1af2ae9dac8a6c260d0c9ce2/"
style="text-decoration: none; font-size: 10px; margin: 0;"
>
<img src="https://pikwizard.com/pw/medium/3a3942ac1af2ae9dac8a6c260d0c9ce2.jpg" style="margin: 0; width: 100%;" alt="" />
<p style="font-size: 12px; margin: 0;">PikWizard</p>
</a>
</span>
</span>
Free (free of charge)
Free for personal and commercial use.
Author: People Creations
Similar Free Stock Images

Premium


Premium


Premium


Premium


Premium


Premium


Premium


Premium


Premium


Premium


Premium


Premium


Premium


Premium


Premium


Premium


Premium


Premium


Premium


Premium


Premium


Premium


Premium


Premium