
- Home >
- Stock Photos >
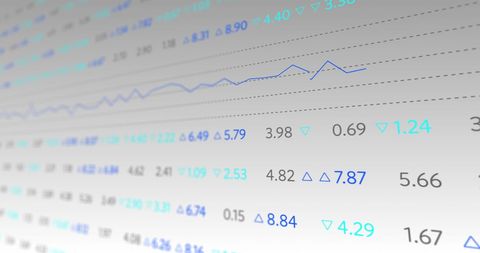
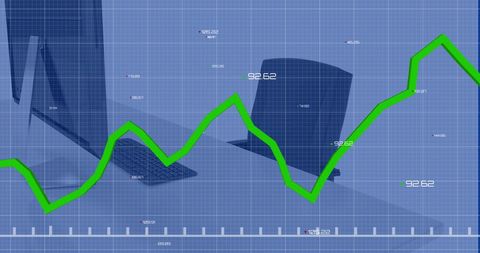
- Rising Arrows Indicative of Positive Financial Data Trends
Rising Arrows Indicative of Positive Financial Data Trends Image

Depicting upward arrows over financial data graphs, symbolizing positive growth and trends in the financial sector. Useful for presentations on economic trends, stock exchange analysis, or as elements in financial reports and technology-related marketing materials.
Powered by 


downloads
Tags:
More
Credit Photo
If you would like to credit the Photo, here are some ways you can do so
Text Link
photo Link
<span class="text-link">
<span>
<a target="_blank" href=https://pikwizard.com/photo/rising-arrows-indicative-of-positive-financial-data-trends/ef59e5f4f029c63df538ebf987163b61/>PikWizard</a>
</span>
</span>
<span class="image-link">
<span
style="margin: 0 0 20px 0; display: inline-block; vertical-align: middle; width: 100%;"
>
<a
target="_blank"
href="https://pikwizard.com/photo/rising-arrows-indicative-of-positive-financial-data-trends/ef59e5f4f029c63df538ebf987163b61/"
style="text-decoration: none; font-size: 10px; margin: 0;"
>
<img src="https://pikwizard.com/pw/medium/ef59e5f4f029c63df538ebf987163b61.jpg" style="margin: 0; width: 100%;" alt="" />
<p style="font-size: 12px; margin: 0;">PikWizard</p>
</a>
</span>
</span>
Free (free of charge)
Free for personal and commercial use.
Author: Awesome Content
Similar Free Stock Images
Loading...

Premium


Premium

Premium


Premium


Premium


Premium


Premium


Premium


Premium


Premium

Premium


Premium


Premium


Premium


Premium


Premium


Premium


Premium


Premium


Premium

Premium

Premium


Premium


Premium


Premium


Explore More Free Stock Images