- Home >
- Stock Photos >
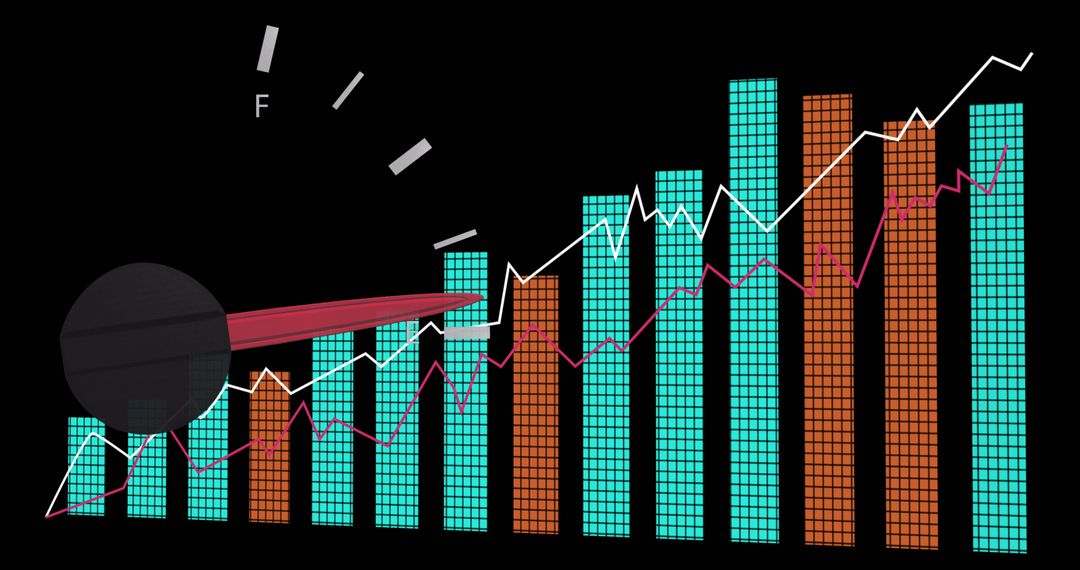
- Rising Bar and Line Graph on Blue Background Shows Financial Growth
Rising Bar and Line Graph on Blue Background Shows Financial Growth Image

Illustrating financial growth through colorful bar and line graphs, this concept emphasizes economic trends and business analytics. Use it for corporate presentations, business reports, or financial publications highlighting successful performance or market analysis.
Powered by  - Get 15% off with code: PIKWIZARD15


2
downloads
downloads
Tags:
More
Credit Photo
If you would like to credit the Photo, here are some ways you can do so
Text Link
photo Link
<span class="text-link">
<span>
<a target="_blank" href=https://pikwizard.com/photo/rising-bar-and-line-graph-on-blue-background-shows-financial-growth/1a0b76b38da9fdc7bf98dab9450836bf/>PikWizard</a>
</span>
</span>
<span class="image-link">
<span
style="margin: 0 0 20px 0; display: inline-block; vertical-align: middle; width: 100%;"
>
<a
target="_blank"
href="https://pikwizard.com/photo/rising-bar-and-line-graph-on-blue-background-shows-financial-growth/1a0b76b38da9fdc7bf98dab9450836bf/"
style="text-decoration: none; font-size: 10px; margin: 0;"
>
<img src="https://pikwizard.com/pw/medium/1a0b76b38da9fdc7bf98dab9450836bf.jpg" style="margin: 0; width: 100%;" alt="" />
<p style="font-size: 12px; margin: 0;">PikWizard</p>
</a>
</span>
</span>
Free (free of charge)
Free for personal and commercial use.
Author: Awesome Content
Similar Free Stock Images

Premium


Premium


Premium


Premium


Premium


Premium


Premium


Premium


Premium


Premium


Premium


Premium


Premium


Premium


Premium


Premium


Premium


Premium


Premium


Premium


Premium


Premium


Premium


Premium