
- Home >
- Stock Photos >
- Rising Bar Chart Indicators in Financial Digital Interface
Rising Bar Chart Indicators in Financial Digital Interface Image
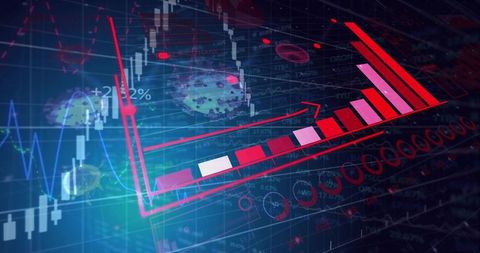
Digital grid displaying a rising bar chart with a prominent upward arrow, illustrating a significant financial increase. Candlestick patterns and data metrics are visible, indicating a sophisticated approach to financial analysis. Useful for presentations, investment insights, data visualization demos, and fintech platforms.
Powered by  - Get 15% off with code: PIKWIZARD15


downloads
Tags:
More
Credit Photo
If you would like to credit the Photo, here are some ways you can do so
Text Link
photo Link
<span class="text-link">
<span>
<a target="_blank" href=https://pikwizard.com/photo/rising-bar-chart-indicators-in-financial-digital-interface/ee0810be5a3777198008a6675111bef5/>PikWizard</a>
</span>
</span>
<span class="image-link">
<span
style="margin: 0 0 20px 0; display: inline-block; vertical-align: middle; width: 100%;"
>
<a
target="_blank"
href="https://pikwizard.com/photo/rising-bar-chart-indicators-in-financial-digital-interface/ee0810be5a3777198008a6675111bef5/"
style="text-decoration: none; font-size: 10px; margin: 0;"
>
<img src="https://pikwizard.com/pw/medium/ee0810be5a3777198008a6675111bef5.jpg" style="margin: 0; width: 100%;" alt="" />
<p style="font-size: 12px; margin: 0;">PikWizard</p>
</a>
</span>
</span>
Free (free of charge)
Free for personal and commercial use.
Author: Creative Art