- Home >
- Stock Photos >
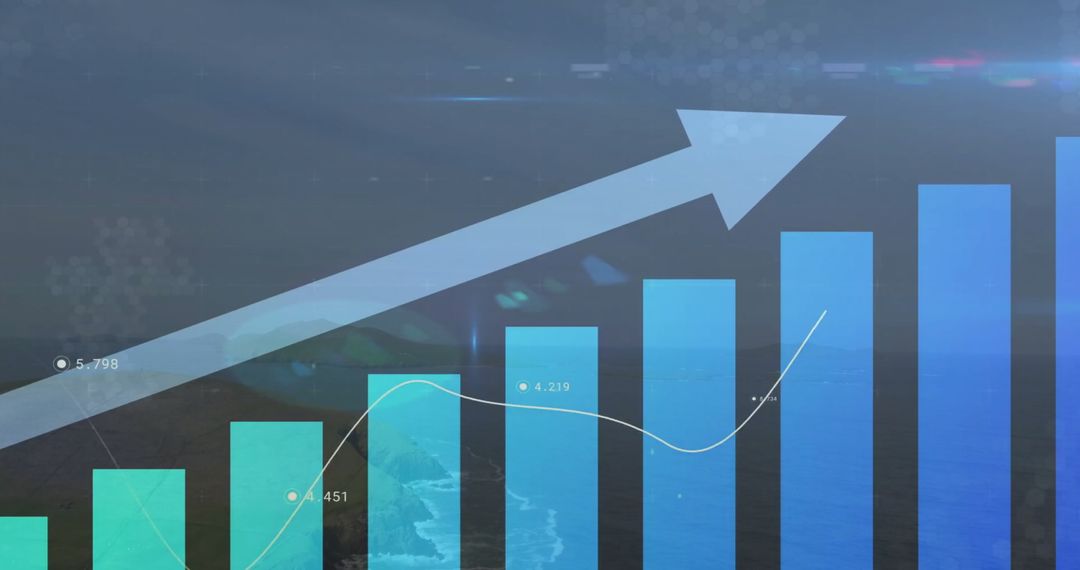
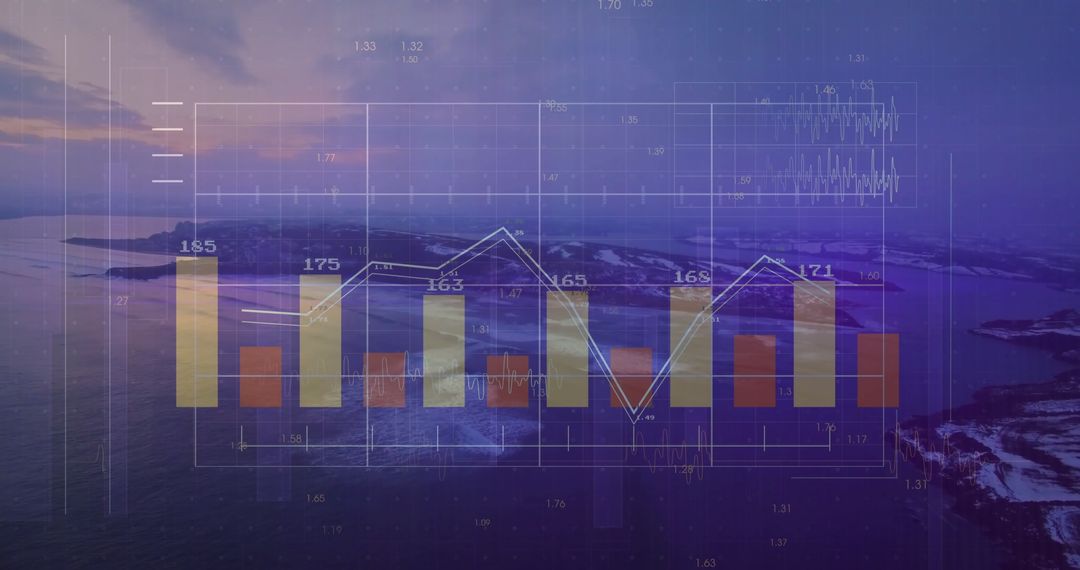
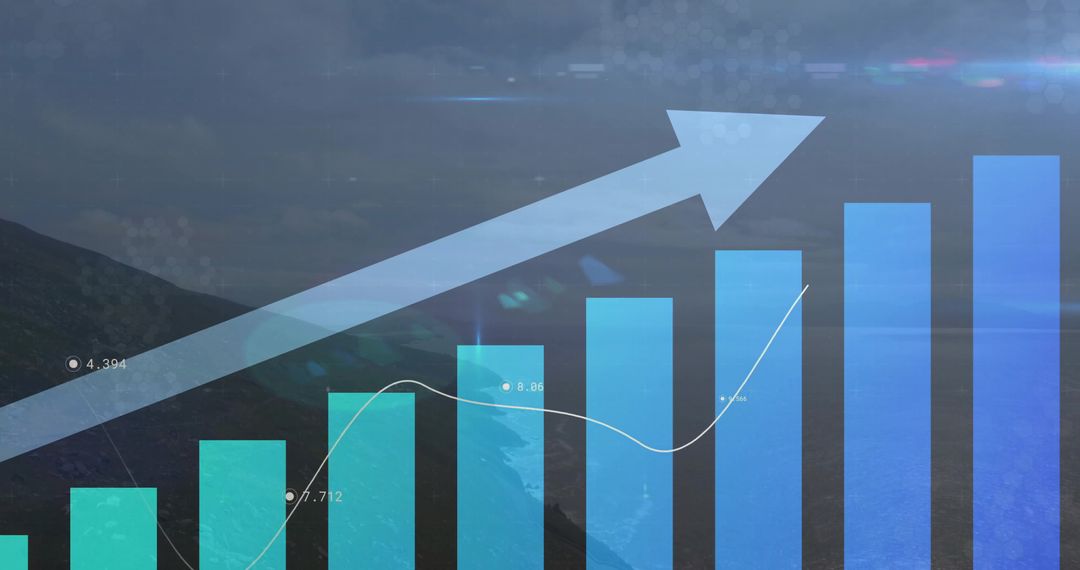
- Rising Bar Chart on Nature Landscape Symbolizing Growth and Innovation
Rising Bar Chart on Nature Landscape Symbolizing Growth and Innovation Image
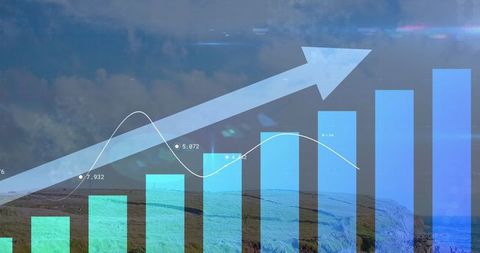
Transparent bar chart with ascending arrow juxtaposed against natural hillside illustrates themes of corporate growth and innovation. Ideal for presentations and reports on business progress, data analytics, strategic planning, and technological advancements.
Powered by  - Get 15% off with code: PIKWIZARD15


2
downloads
downloads
Tags:
More
Credit Photo
If you would like to credit the Photo, here are some ways you can do so
Text Link
photo Link
<span class="text-link">
<span>
<a target="_blank" href=https://pikwizard.com/photo/rising-bar-chart-on-nature-landscape-symbolizing-growth-and-innovation/d957b37f712b9cec2c665fee02597f06/>PikWizard</a>
</span>
</span>
<span class="image-link">
<span
style="margin: 0 0 20px 0; display: inline-block; vertical-align: middle; width: 100%;"
>
<a
target="_blank"
href="https://pikwizard.com/photo/rising-bar-chart-on-nature-landscape-symbolizing-growth-and-innovation/d957b37f712b9cec2c665fee02597f06/"
style="text-decoration: none; font-size: 10px; margin: 0;"
>
<img src="https://pikwizard.com/pw/medium/d957b37f712b9cec2c665fee02597f06.jpg" style="margin: 0; width: 100%;" alt="" />
<p style="font-size: 12px; margin: 0;">PikWizard</p>
</a>
</span>
</span>
Free (free of charge)
Free for personal and commercial use.
Author: Awesome Content
Similar Free Stock Images

Premium


Premium


Premium


Premium


Premium


Premium


Premium


Premium


Premium


Premium


Premium


Premium


Premium


Premium


Premium


Premium


Premium


Premium


Premium


Premium


Premium


Premium


Premium


Premium