- Home >
- Stock Photos >
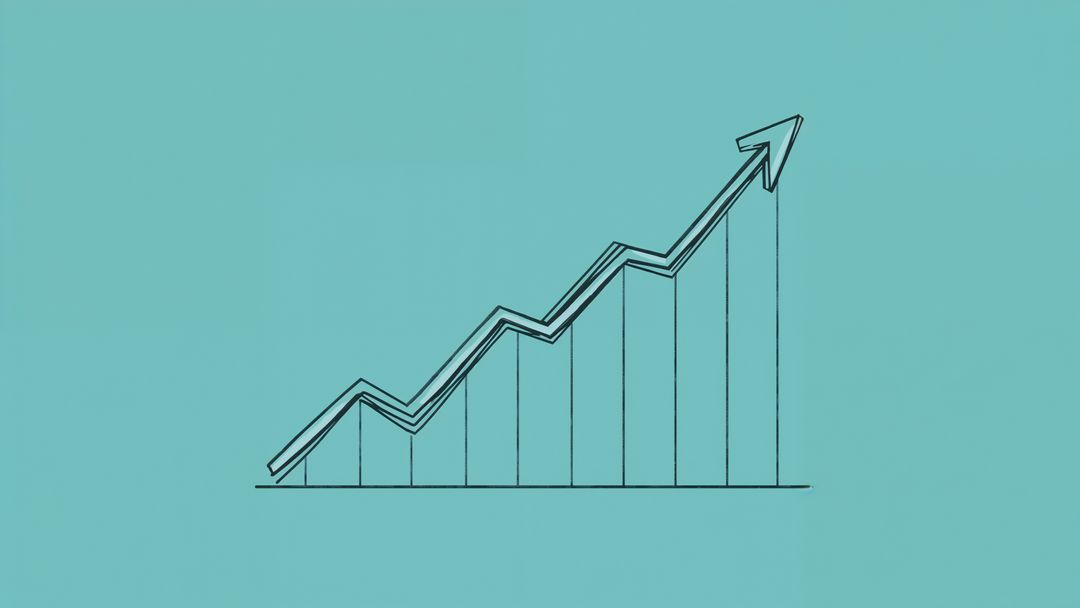
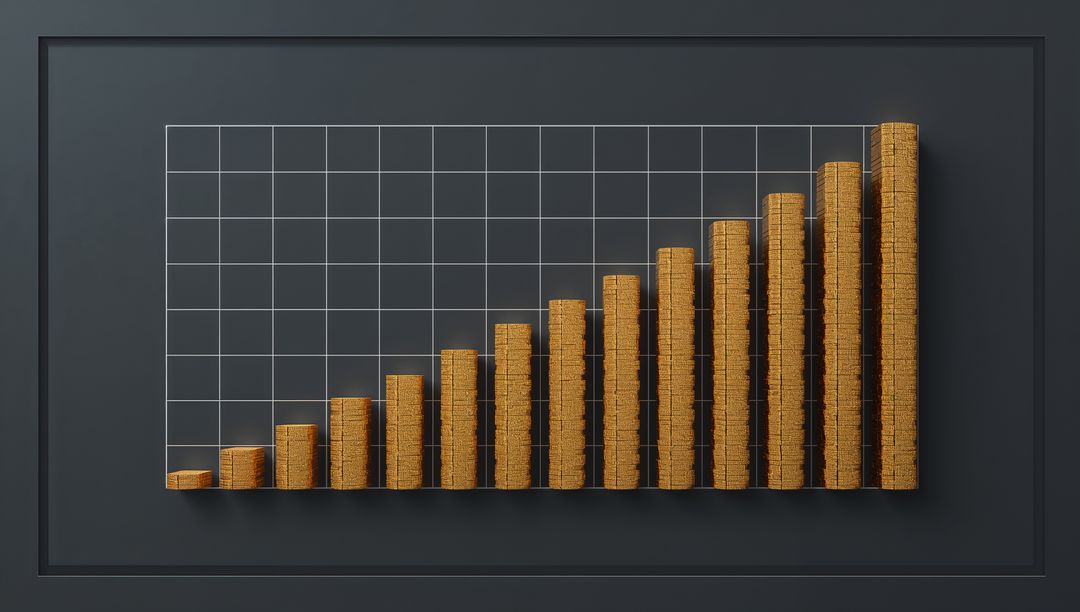
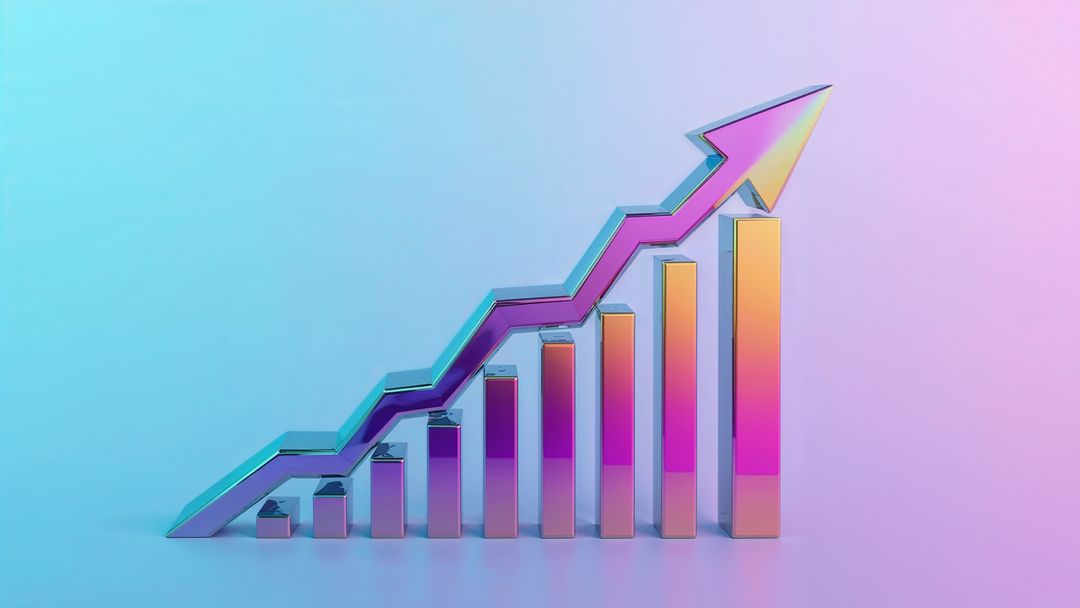
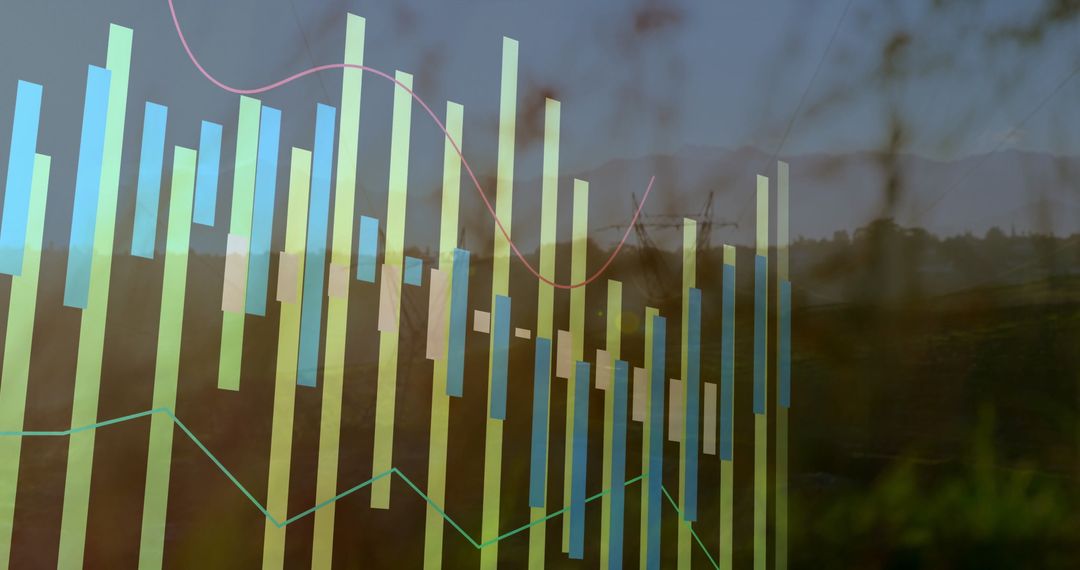
- Rising Bar Chart with Monitor on Yellow Background Symbolizing Growth
Rising Bar Chart with Monitor on Yellow Background Symbolizing Growth Image
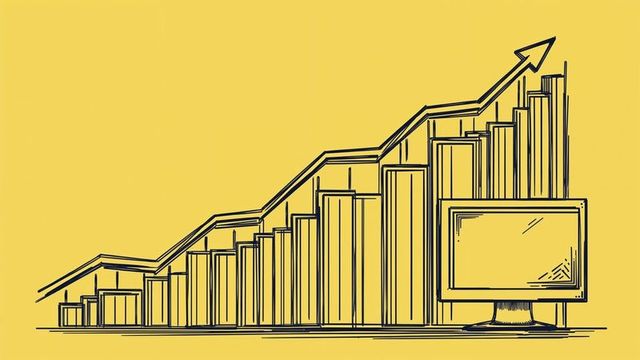
AI Generated Image. Illustration showcases upward moving bar chart alongside computer monitor on bright yellow backdrop. Evokes concepts of business growth, data analytics, and technology advancements. Ideal for use in educational materials, presentations on data growth strategies, or articles about financial success. Suitable for technology blogs, attracting attention through its minimalistic and theoretical design indicating progress and advancement.
Powered by  - Get 15% off with code: PIKWIZARD15


0
downloads
downloads
Tags:
More
Credit Photo
If you would like to credit the Photo, here are some ways you can do so
Text Link
photo Link
<span class="text-link">
<span>
<a target="_blank" href=https://pikwizard.com/photo/rising-bar-chart-with-monitor-on-yellow-background-symbolizing-growth/17e522be6f168a1466b7b19122b72cd1/>PikWizard</a>
</span>
</span>
<span class="image-link">
<span
style="margin: 0 0 20px 0; display: inline-block; vertical-align: middle; width: 100%;"
>
<a
target="_blank"
href="https://pikwizard.com/photo/rising-bar-chart-with-monitor-on-yellow-background-symbolizing-growth/17e522be6f168a1466b7b19122b72cd1/"
style="text-decoration: none; font-size: 10px; margin: 0;"
>
<img src="https://pikwizard.com/pw/medium/17e522be6f168a1466b7b19122b72cd1.jpg" style="margin: 0; width: 100%;" alt="" />
<p style="font-size: 12px; margin: 0;">PikWizard</p>
</a>
</span>
</span>
Free (free of charge)
Free for personal and commercial use.
Author: AI Creator
Similar Free Stock Images

Premium


Premium


Premium


Premium


Premium


Premium


Premium


Premium


Premium


Premium


Premium

Premium


Premium


Premium


Premium


Premium


Premium


Premium


Premium


Premium


Premium


Premium


Premium


Premium