- Home >
- Stock Photos >
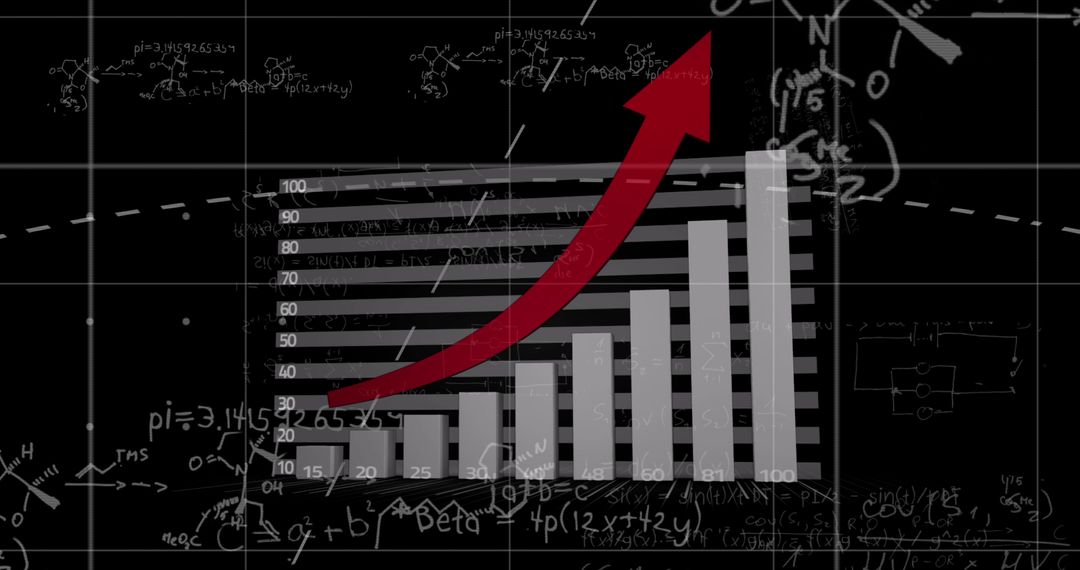
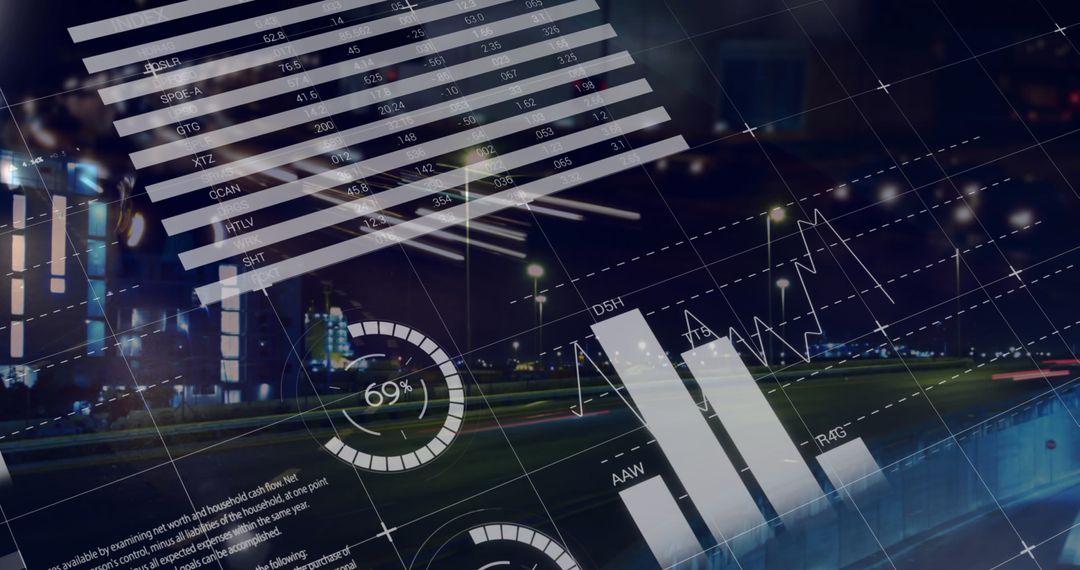
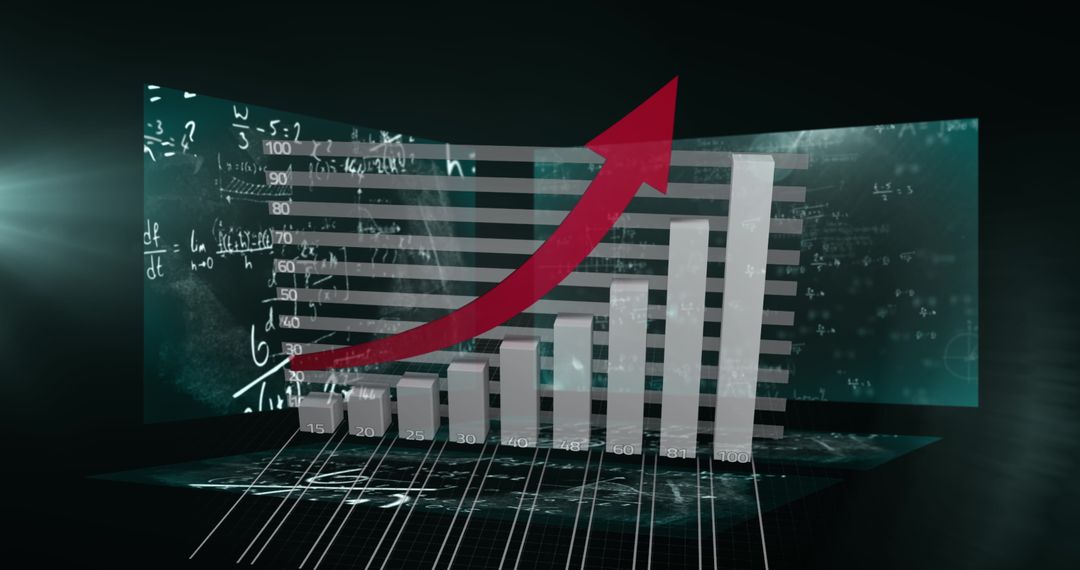
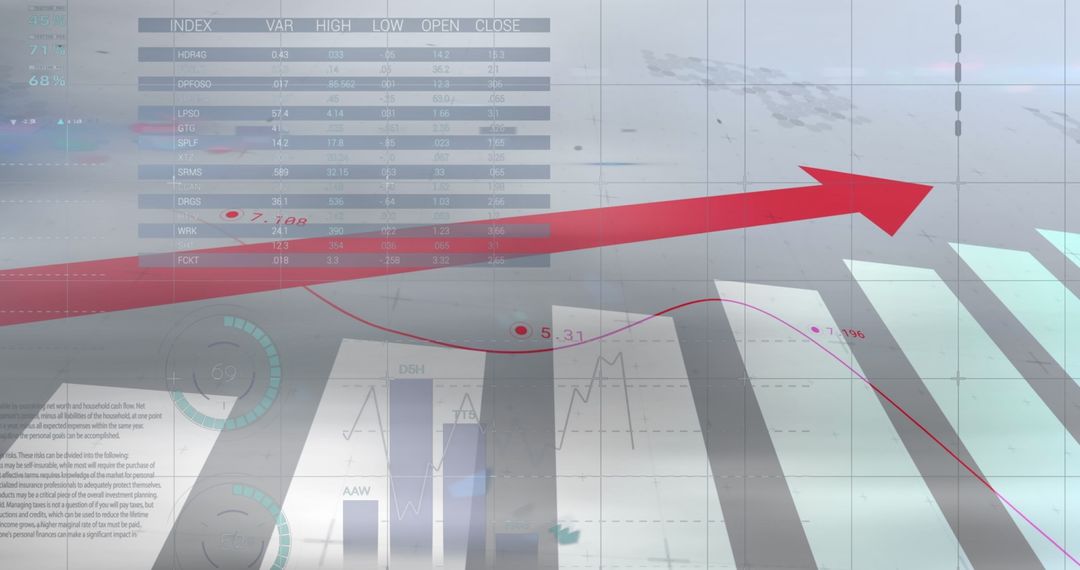
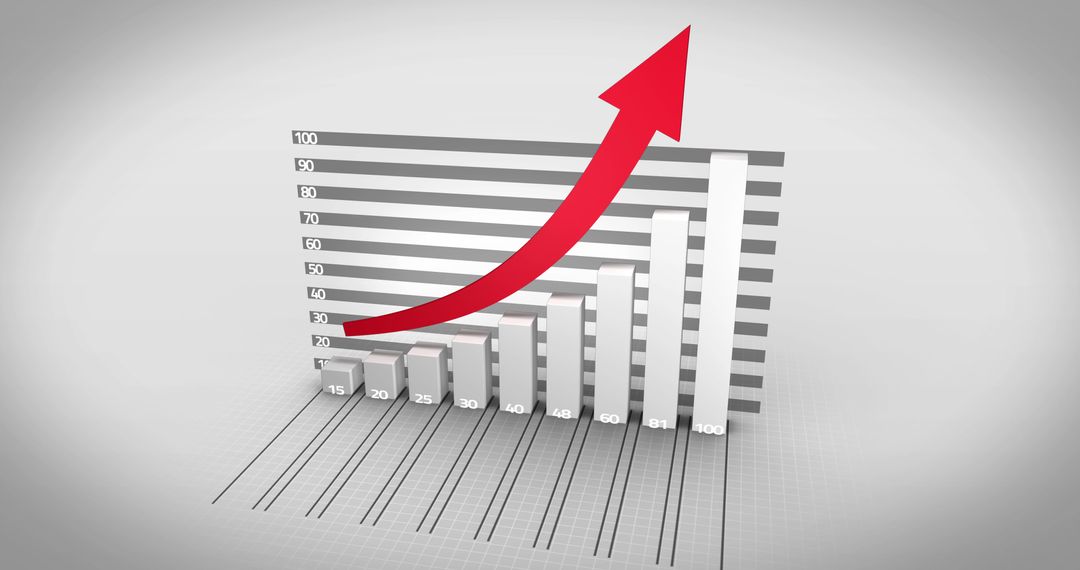
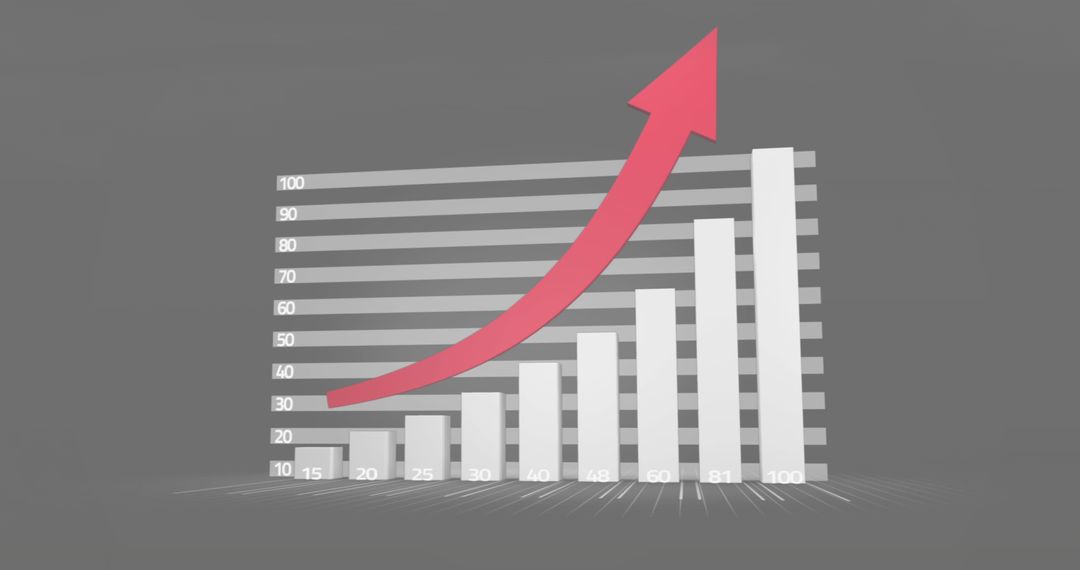
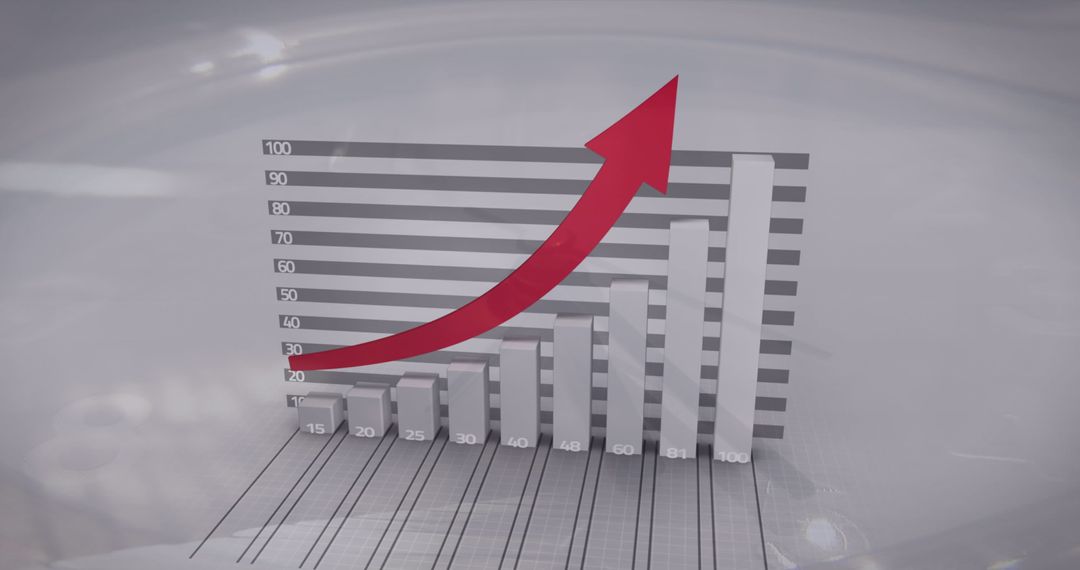
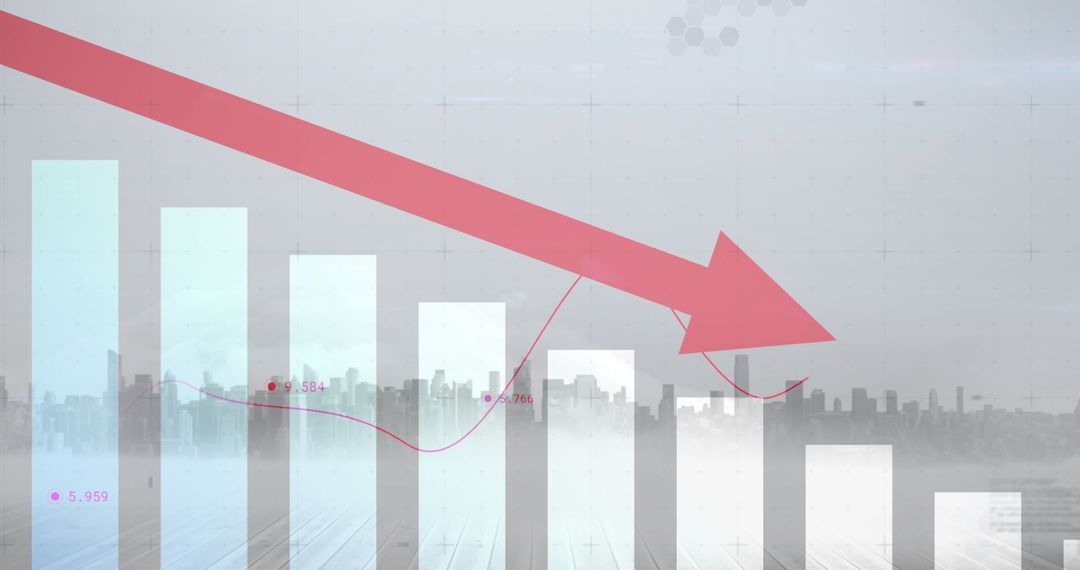
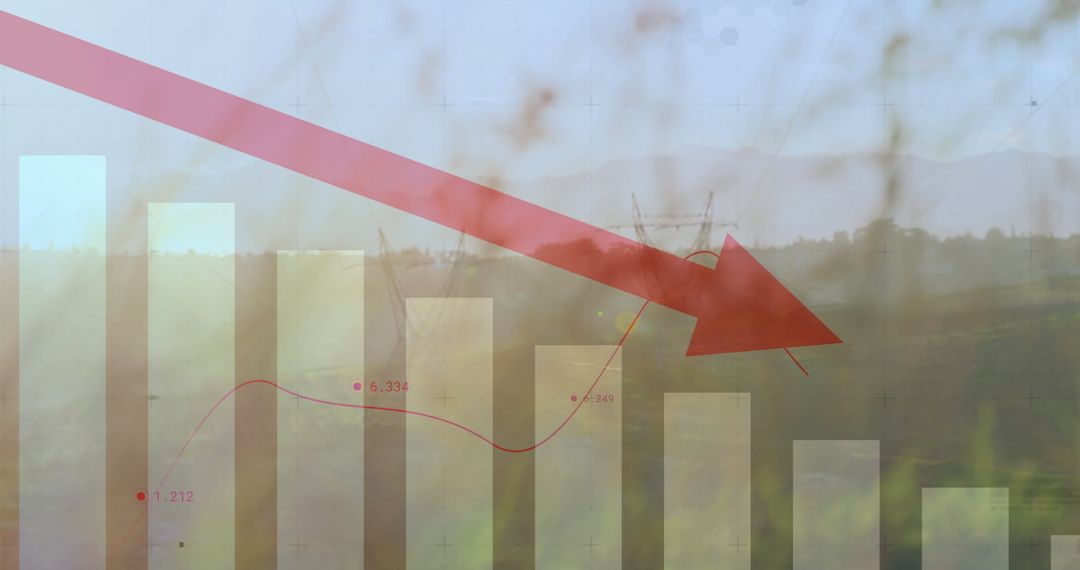
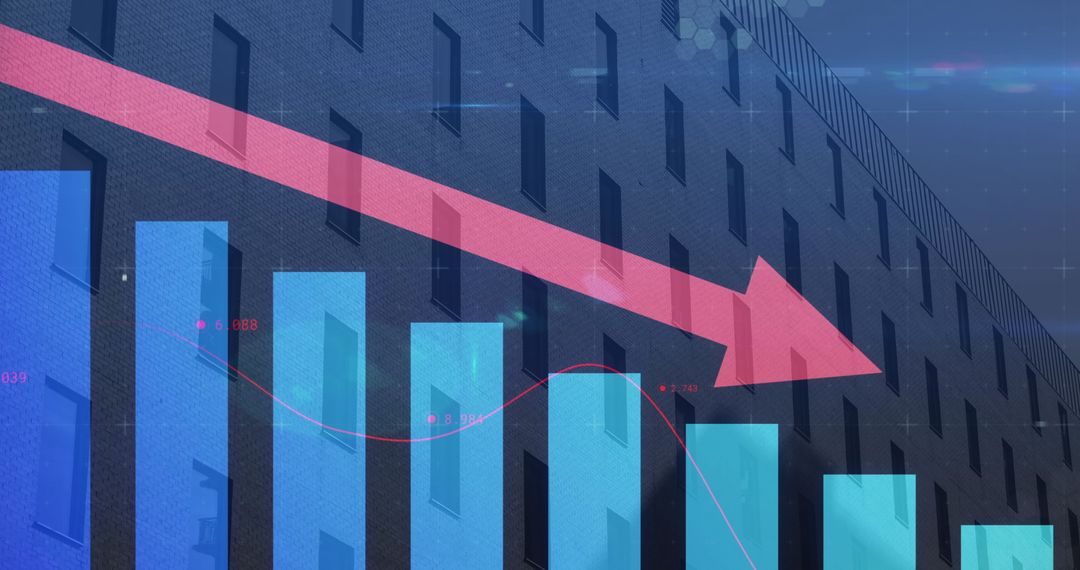
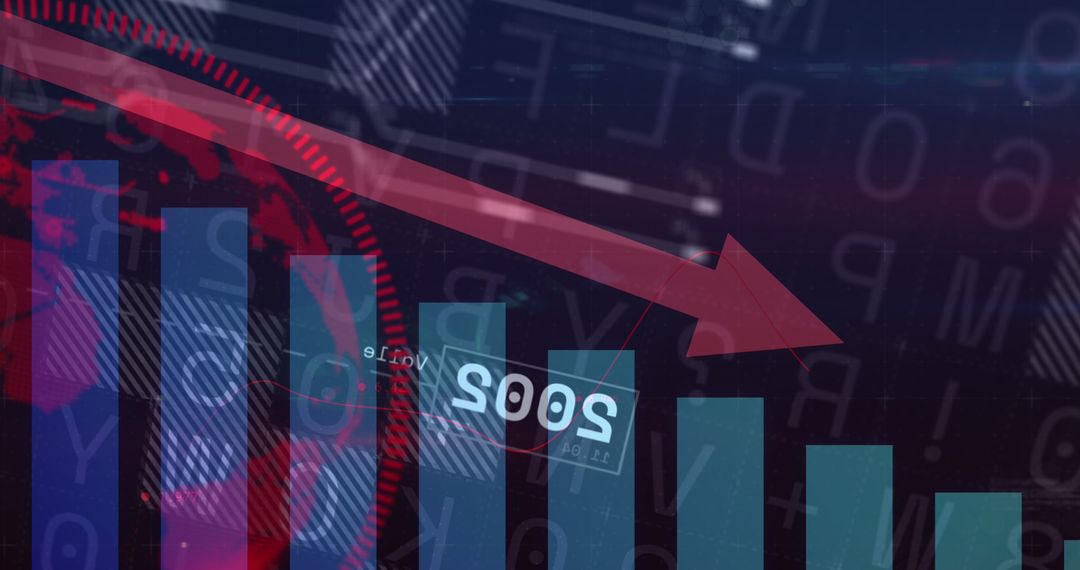
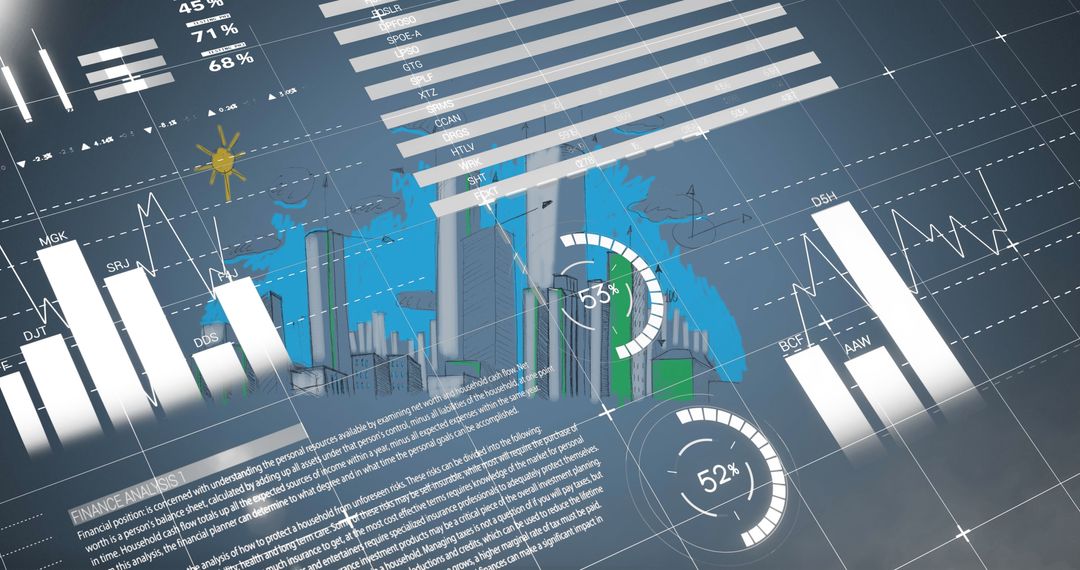
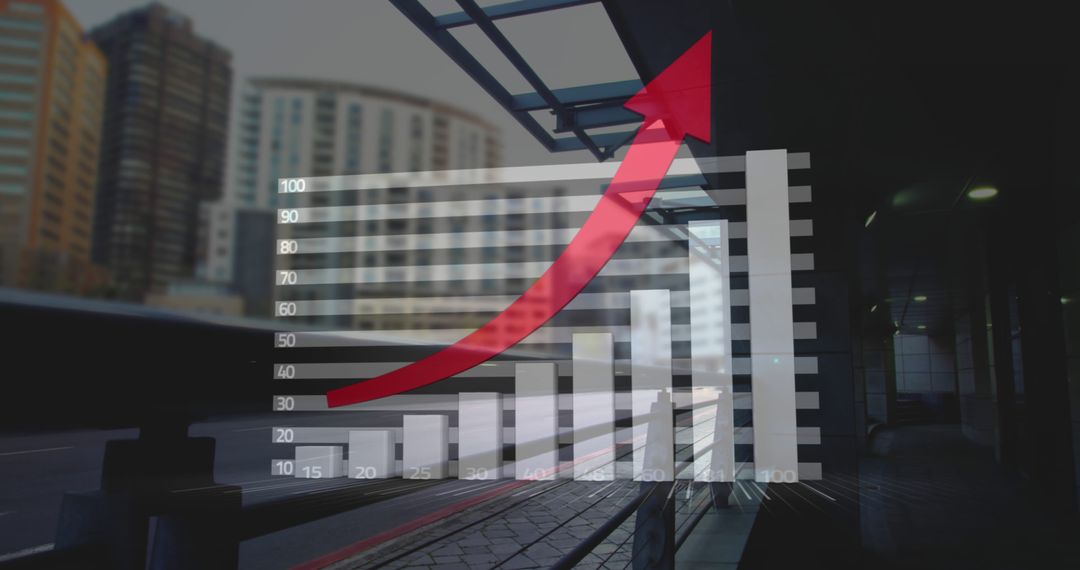
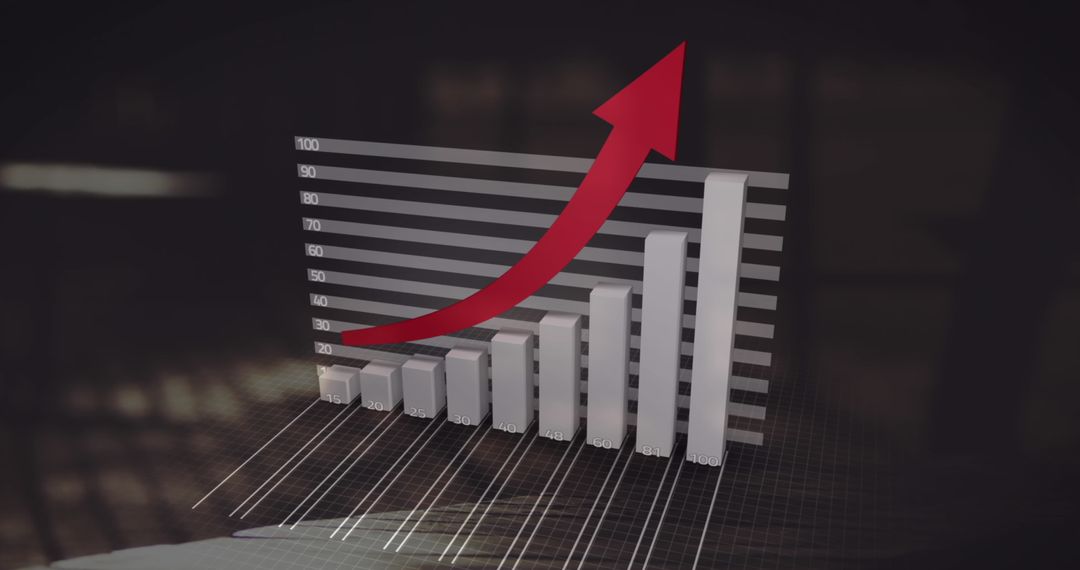
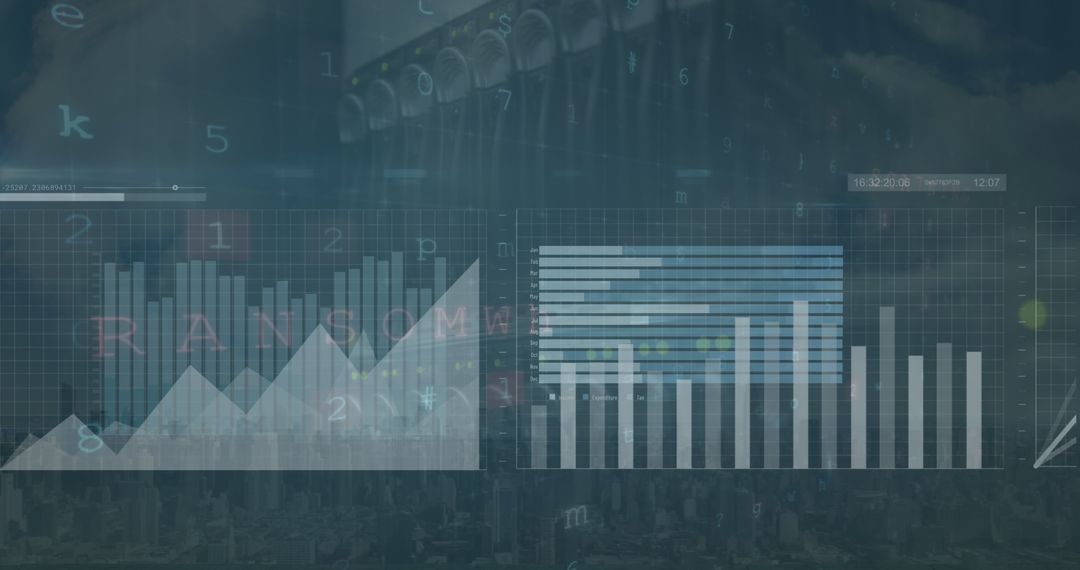
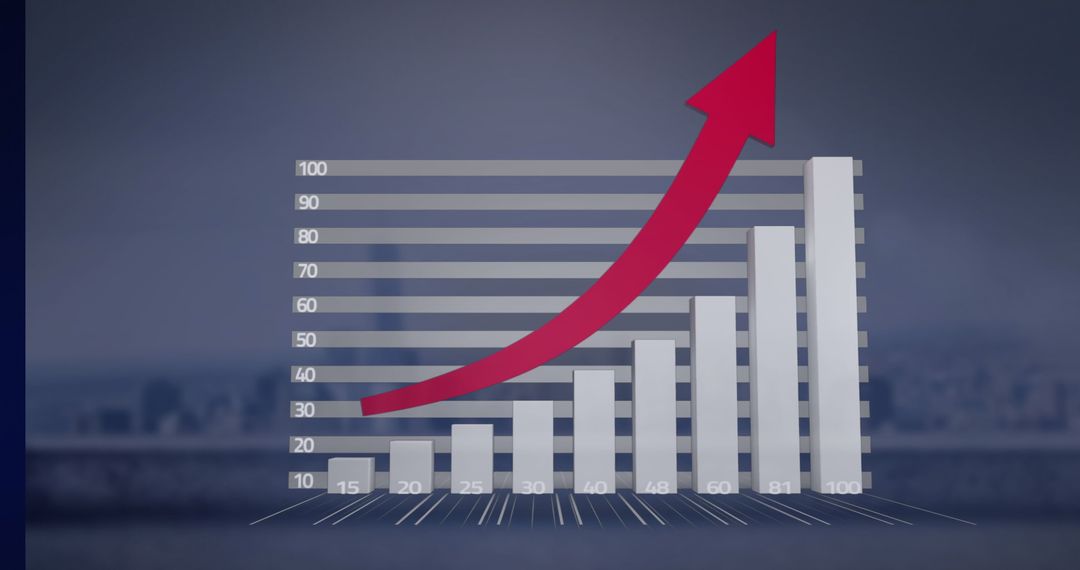
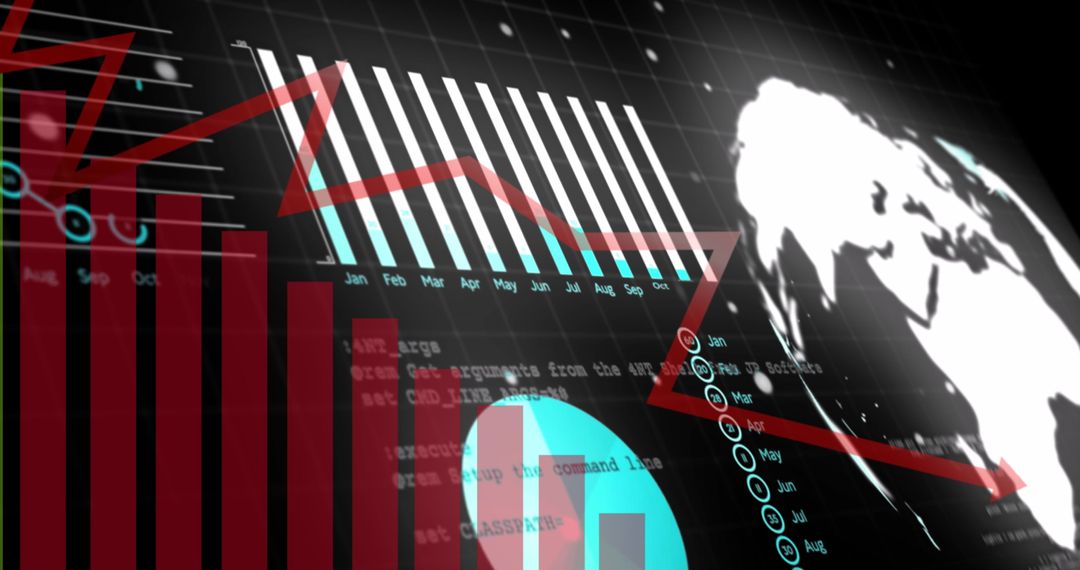
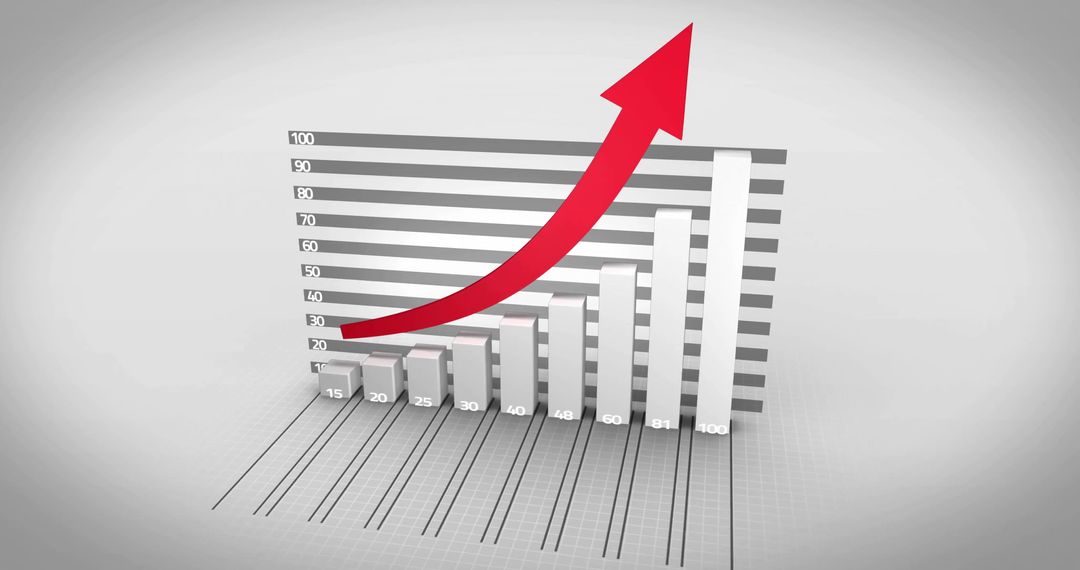
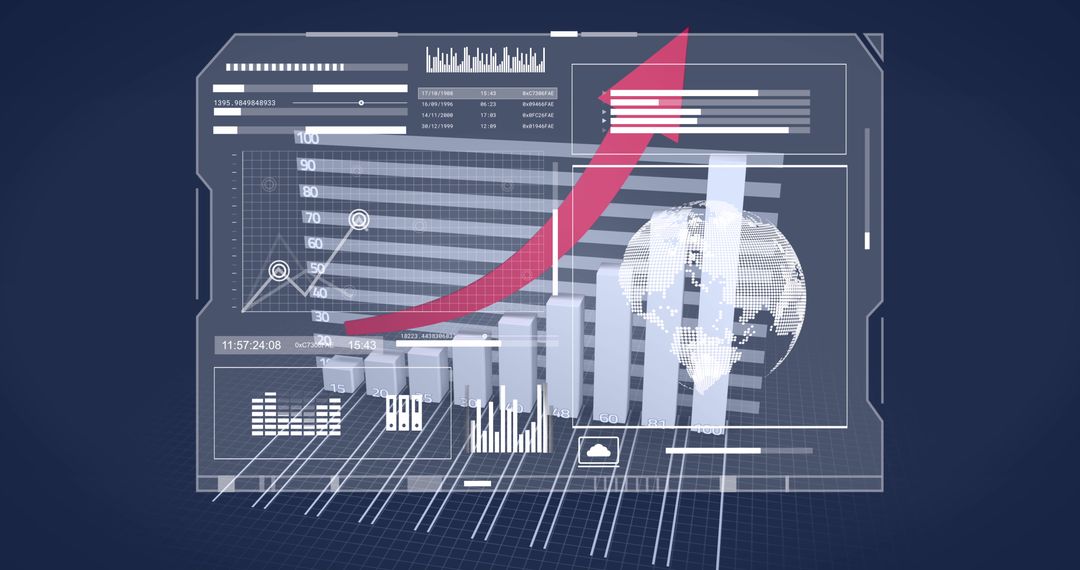
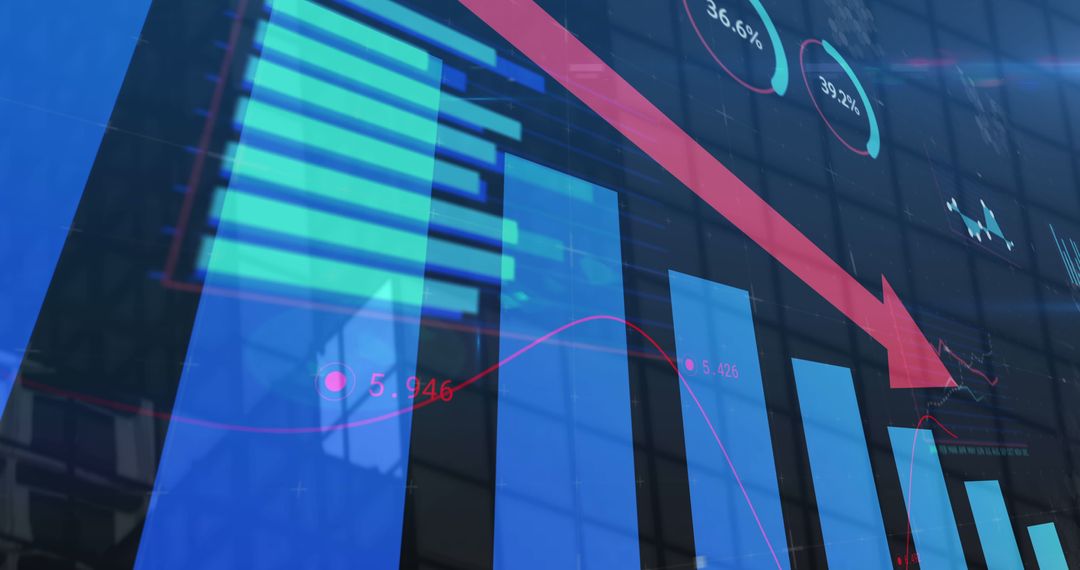
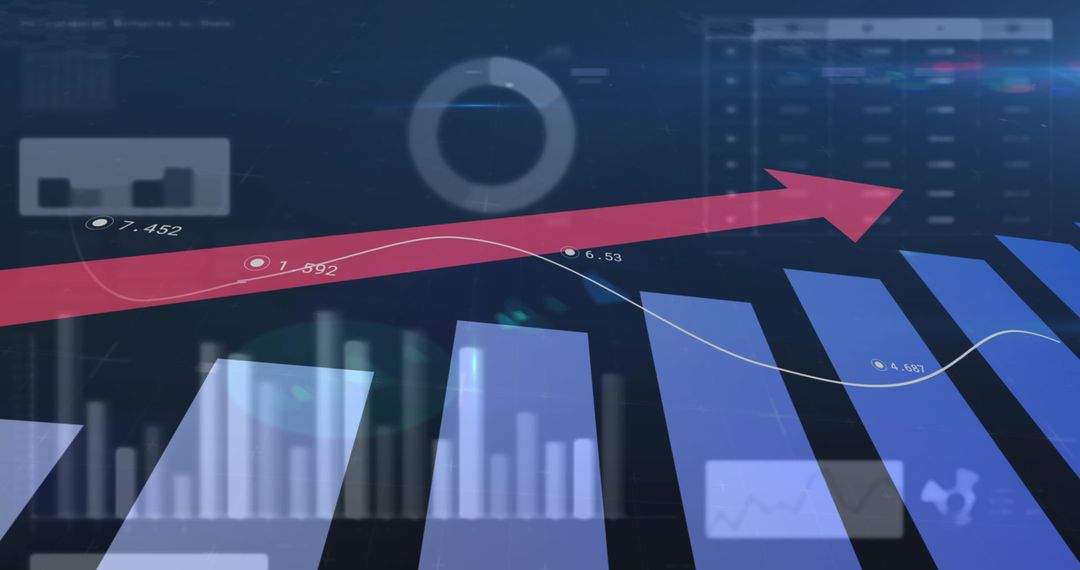
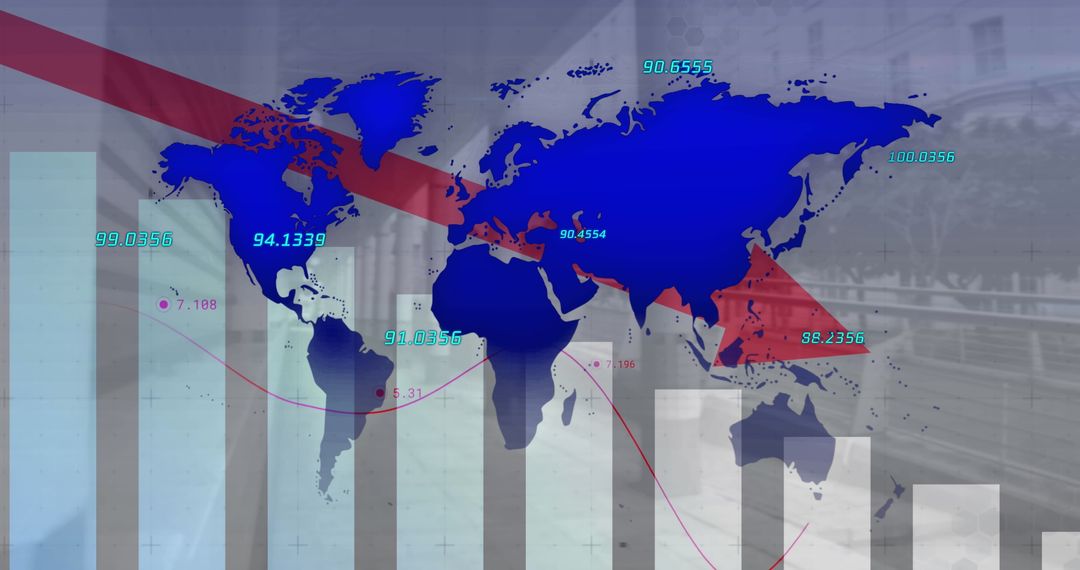
- Rising Bar Graph Against Digital Background Forecasts Economic Growth
Rising Bar Graph Against Digital Background Forecasts Economic Growth Image
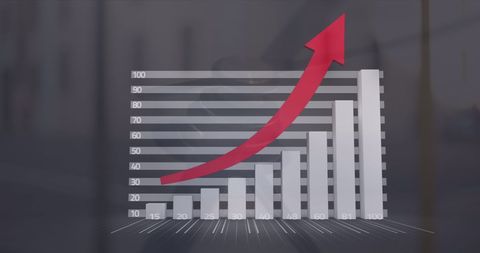
Bar graph showing increasing data with red arrow represents economic growth in dynamic style. Perfect for presentations on business performance, economic forecasts, statistical analysis, or investment strategies. Ideal visual aid for conveying success or upward trends in reports or slides.
Powered by  - Get 15% off with code: PIKWIZARD15


2
downloads
downloads
Tags:
More
Credit Photo
If you would like to credit the Photo, here are some ways you can do so
Text Link
photo Link
<span class="text-link">
<span>
<a target="_blank" href=https://pikwizard.com/photo/rising-bar-graph-against-digital-background-forecasts-economic-growth/74cd434d41ef51c94e7c0ca9df2f814b/>PikWizard</a>
</span>
</span>
<span class="image-link">
<span
style="margin: 0 0 20px 0; display: inline-block; vertical-align: middle; width: 100%;"
>
<a
target="_blank"
href="https://pikwizard.com/photo/rising-bar-graph-against-digital-background-forecasts-economic-growth/74cd434d41ef51c94e7c0ca9df2f814b/"
style="text-decoration: none; font-size: 10px; margin: 0;"
>
<img src="https://pikwizard.com/pw/medium/74cd434d41ef51c94e7c0ca9df2f814b.jpg" style="margin: 0; width: 100%;" alt="" />
<p style="font-size: 12px; margin: 0;">PikWizard</p>
</a>
</span>
</span>
Free (free of charge)
Free for personal and commercial use.
Author: Authentic Images
Similar Free Stock Images
Premium


Premium

Premium

Premium


Premium


Premium


Premium


Premium

Premium


Premium


Premium


Premium


Premium


Premium

Premium

Premium


Premium


Premium


Premium


Premium


Premium


Premium


Premium


Premium