- Home >
- Stock Photos >
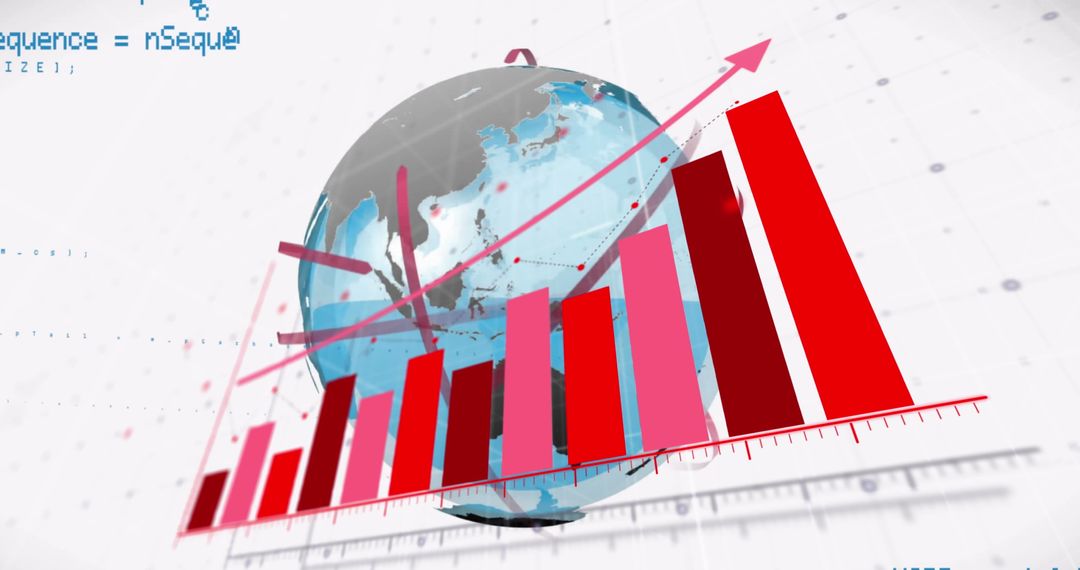
- Rising Bar Graph on Globe with Global Data Art
Rising Bar Graph on Globe with Global Data Art Image

This illustration shows a vibrant bar graph with an upward-moving arrow overlaid onto a globe, symbolizing economic and business growth in a global context. This concept art can be used in financial reports, presentations, and materials focusing on globalization and economic trends, emphasizing themes like growth, data analytics, and profit optimization.
Powered by 


0
downloads
downloads
Tags:
More
Credit Photo
If you would like to credit the Photo, here are some ways you can do so
Text Link
photo Link
<span class="text-link">
<span>
<a target="_blank" href=https://pikwizard.com/photo/rising-bar-graph-on-globe-with-global-data-art/faf6ffbdc210df56620206058f81752a/>PikWizard</a>
</span>
</span>
<span class="image-link">
<span
style="margin: 0 0 20px 0; display: inline-block; vertical-align: middle; width: 100%;"
>
<a
target="_blank"
href="https://pikwizard.com/photo/rising-bar-graph-on-globe-with-global-data-art/faf6ffbdc210df56620206058f81752a/"
style="text-decoration: none; font-size: 10px; margin: 0;"
>
<img src="https://pikwizard.com/pw/medium/faf6ffbdc210df56620206058f81752a.jpg" style="margin: 0; width: 100%;" alt="" />
<p style="font-size: 12px; margin: 0;">PikWizard</p>
</a>
</span>
</span>
Free (free of charge)
Free for personal and commercial use.
Author: Awesome Content
Similar Free Stock Images

Premium


Premium


Premium


Premium


Premium


Premium


Premium


Premium


Premium


Premium


Premium


Premium


Premium


Premium


Premium


Premium


Premium


Premium


Premium


Premium


Premium


Premium


Premium


Premium