- Home >
- Stock Photos >
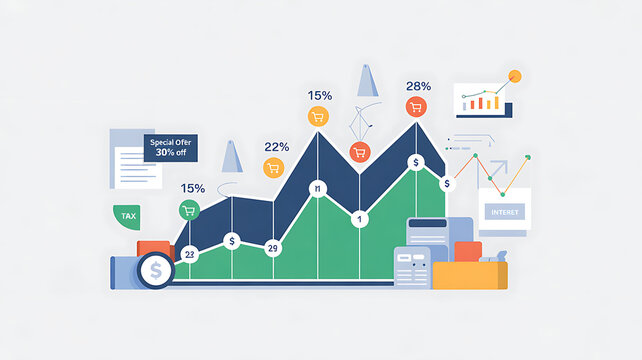
- Rising Bar Graph with Cityscape Background Symbolizing Business Growth
Rising Bar Graph with Cityscape Background Symbolizing Business Growth Image

Illustrating data-driven progress, this visualization features a dynamic bar graph overlaying a cityscape, symbolizing business growth and financial success. The rising arrow and wave line depict positive data trends, ideal for presentations on economic analysis, corporate strategy, and data insights. Useful for business reports, financial marketing, and educational materials on statistics.
Powered by 


2
downloads
downloads
Tags:
More
Credit Photo
If you would like to credit the Photo, here are some ways you can do so
Text Link
photo Link
<span class="text-link">
<span>
<a target="_blank" href=https://pikwizard.com/photo/rising-bar-graph-with-cityscape-background-symbolizing-business-growth/7c1608820e883c5b1bc341c57ba7cb32/>PikWizard</a>
</span>
</span>
<span class="image-link">
<span
style="margin: 0 0 20px 0; display: inline-block; vertical-align: middle; width: 100%;"
>
<a
target="_blank"
href="https://pikwizard.com/photo/rising-bar-graph-with-cityscape-background-symbolizing-business-growth/7c1608820e883c5b1bc341c57ba7cb32/"
style="text-decoration: none; font-size: 10px; margin: 0;"
>
<img src="https://pikwizard.com/pw/medium/7c1608820e883c5b1bc341c57ba7cb32.jpg" style="margin: 0; width: 100%;" alt="" />
<p style="font-size: 12px; margin: 0;">PikWizard</p>
</a>
</span>
</span>
Free (free of charge)
Free for personal and commercial use.
Author: Creative Art
Similar Free Stock Images

Premium


Premium


Premium


Premium


Premium


Premium


Premium


Premium


Premium


Premium


Premium


Premium


Premium


Premium


Premium


Premium


Premium


Premium


Premium


Premium


Premium


Premium


Premium


Premium