
- Home >
- Stock Photos >
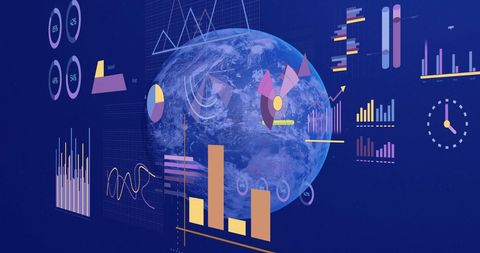
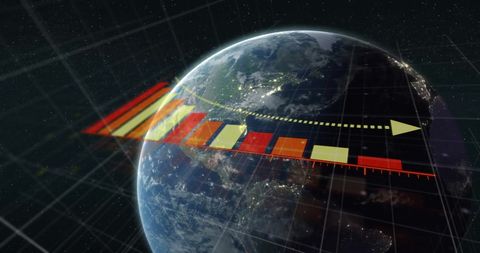
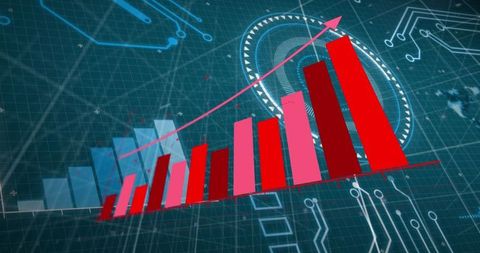
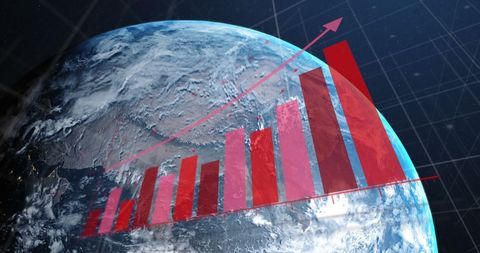
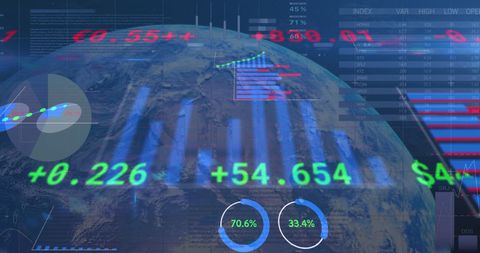
- Rising Bar Graph with Globe and Code Background Vision
Rising Bar Graph with Globe and Code Background Vision Image
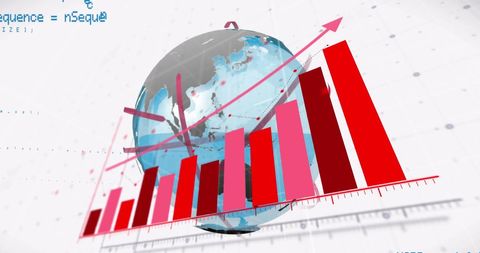
Representation of advancing data measurement with a ascending bar graph over infographic style. Ideal for financial presentations, business trends analysis, and market forecasting materials. Electrify reports with technology, globalization, modern economic changes themes.
Powered by  - Get 15% off with code: PIKWIZARD15


downloads
Tags:
More
Credit Photo
If you would like to credit the Photo, here are some ways you can do so
Text Link
photo Link
<span class="text-link">
<span>
<a target="_blank" href=https://pikwizard.com/photo/rising-bar-graph-with-globe-and-code-background-vision/71447dc16b753f2438c92235ad3fbe77/>PikWizard</a>
</span>
</span>
<span class="image-link">
<span
style="margin: 0 0 20px 0; display: inline-block; vertical-align: middle; width: 100%;"
>
<a
target="_blank"
href="https://pikwizard.com/photo/rising-bar-graph-with-globe-and-code-background-vision/71447dc16b753f2438c92235ad3fbe77/"
style="text-decoration: none; font-size: 10px; margin: 0;"
>
<img src="https://pikwizard.com/pw/medium/71447dc16b753f2438c92235ad3fbe77.jpg" style="margin: 0; width: 100%;" alt="" />
<p style="font-size: 12px; margin: 0;">PikWizard</p>
</a>
</span>
</span>
Free (free of charge)
Free for personal and commercial use.
Author: People Creations
Similar Free Stock Images

Premium


Premium


Premium


Premium

Premium


Premium

Premium


Premium


Premium


Premium

Premium

Premium


Premium

Premium

Premium

Premium


Premium


Premium


Premium


Premium


Premium


Premium

Premium


Premium

Premium


Explore More Free Stock Images