- Home >
- Stock Photos >
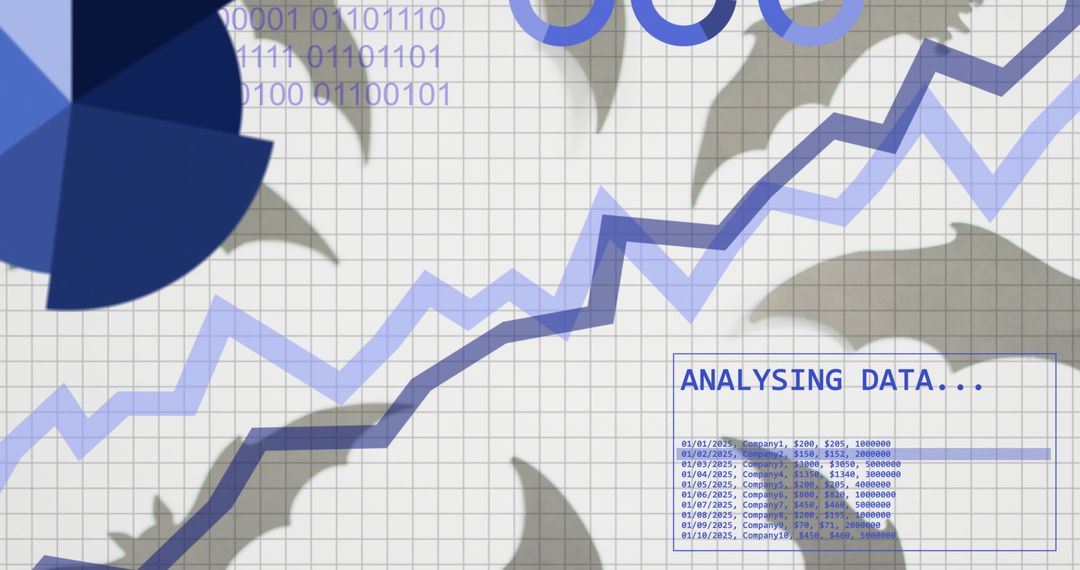
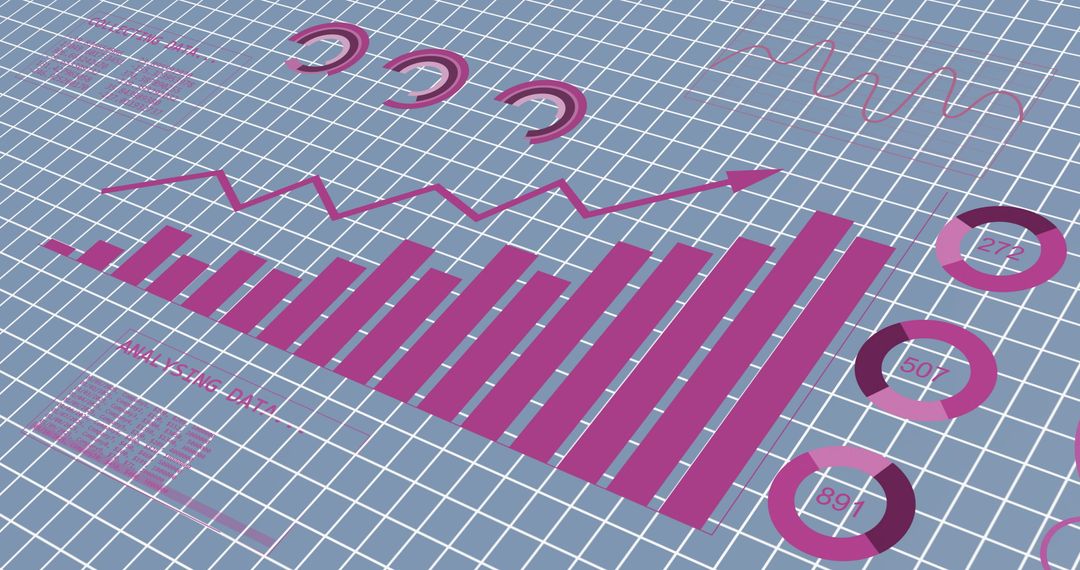
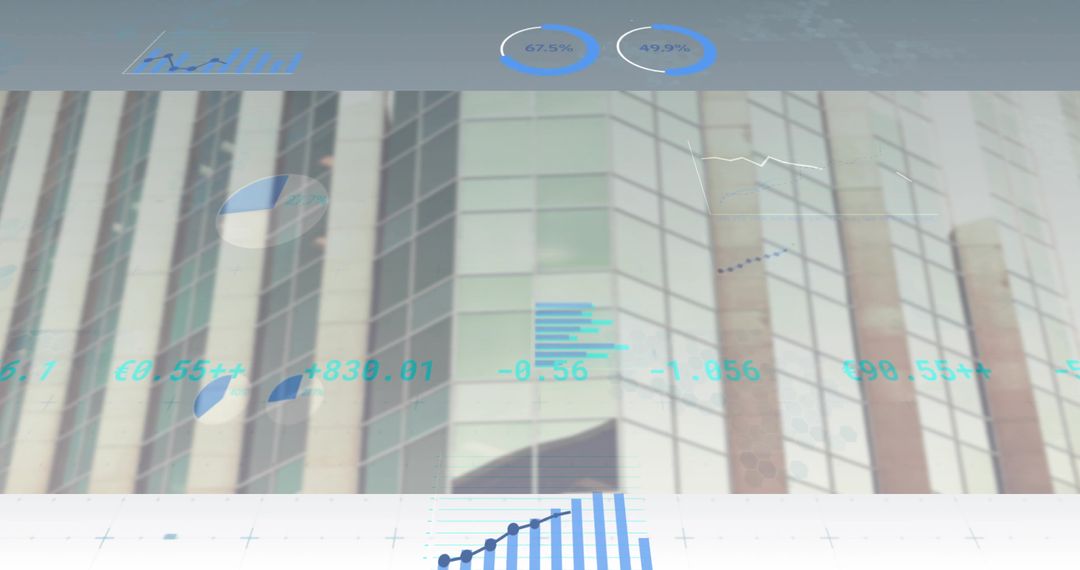
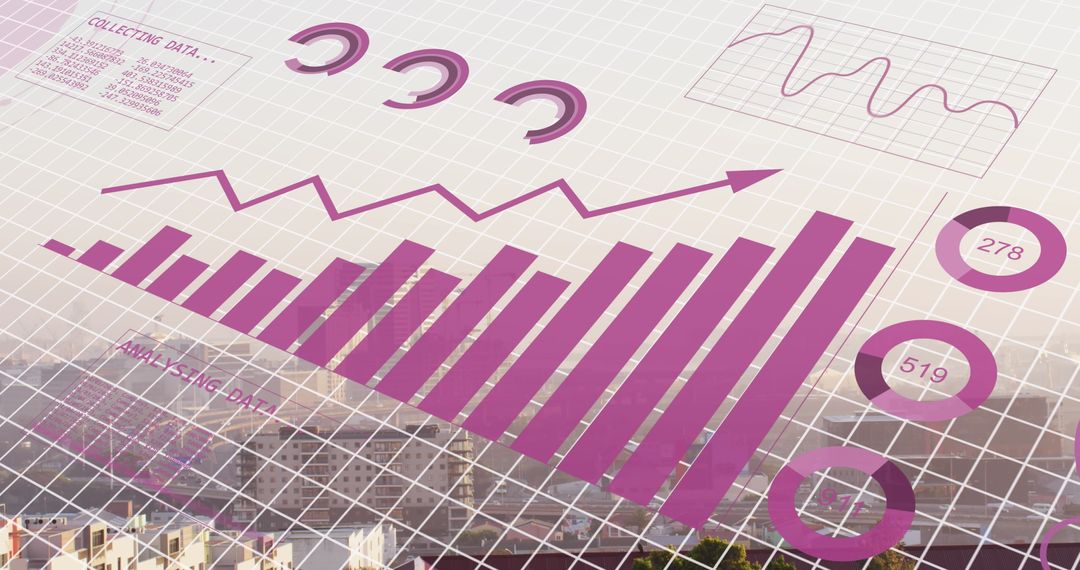
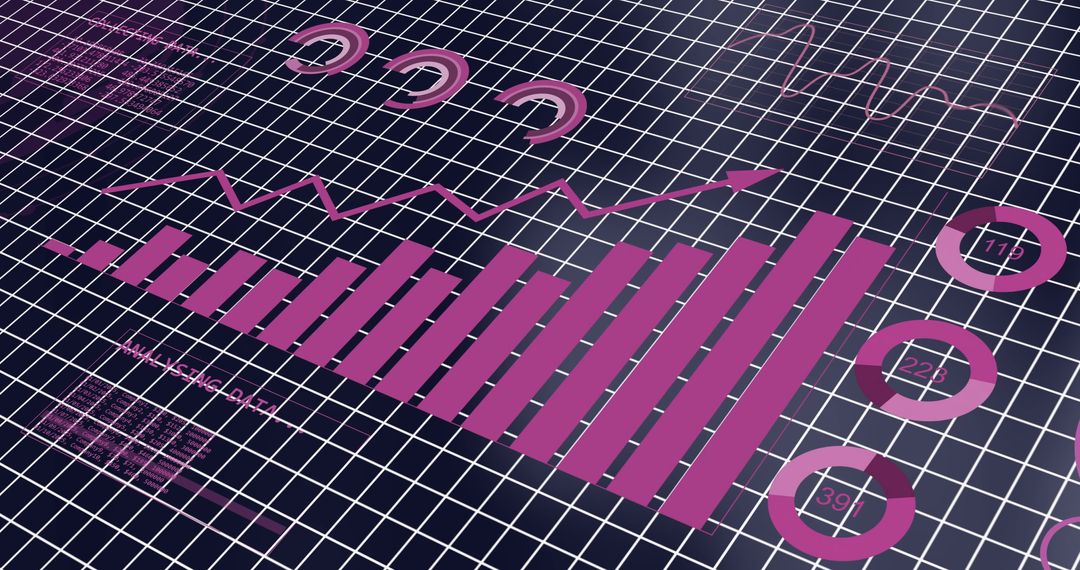
- Rising blue bar chart with jagged trend line and circular metrics over beige grid
Rising blue bar chart with jagged trend line and circular metrics over beige grid Image

Showing rising blue bar chart and jagged trend line over beige grid with concentric circular metrics labeled 98, 182, 320 and subtle dreamcatcher and bat silhouette in background. Clean geometric layout and bold blue accents creating high contrast for quick data recognition and modern visual appeal. Ideal for business reporting, dashboard mockups, financial growth articles, analytics blog headers, presentation slides, marketing campaigns, social media posts, website hero banners. Suggestions for use: overlaying brand logo, replacing metric values, adding animated transitions for video intros, cropping for banner or thumbnail formats, applying color adjustments to match brand palette. Suitable for visualizing growth metrics, monthly performance, KPI tracking, market research summaries, fintech or creative analytics storytelling.
Powered by 


0
downloads
downloads
Tags:
More
Credit Photo
If you would like to credit the Photo, here are some ways you can do so
Text Link
photo Link
<span class="text-link">
<span>
<a target="_blank" href=https://pikwizard.com/photo/rising-blue-bar-chart-with-jagged-trend-line-and-circular-metrics-over-beige-grid/cdcd62e6e742d5afbddbae1e080f14e8/>PikWizard</a>
</span>
</span>
<span class="image-link">
<span
style="margin: 0 0 20px 0; display: inline-block; vertical-align: middle; width: 100%;"
>
<a
target="_blank"
href="https://pikwizard.com/photo/rising-blue-bar-chart-with-jagged-trend-line-and-circular-metrics-over-beige-grid/cdcd62e6e742d5afbddbae1e080f14e8/"
style="text-decoration: none; font-size: 10px; margin: 0;"
>
<img src="https://pikwizard.com/pw/medium/cdcd62e6e742d5afbddbae1e080f14e8.jpg" style="margin: 0; width: 100%;" alt="" />
<p style="font-size: 12px; margin: 0;">PikWizard</p>
</a>
</span>
</span>
Free (free of charge)
Free for personal and commercial use.
Author: People Creations
Similar Free Stock Images

Premium


Premium


Premium


Premium


Premium


Premium


Premium


Premium


Premium


Premium


Premium


Premium


Premium


Premium


Premium


Premium


Premium


Premium


Premium


Premium


Premium


Premium


Premium


Premium