- Home >
- Stock Photos >
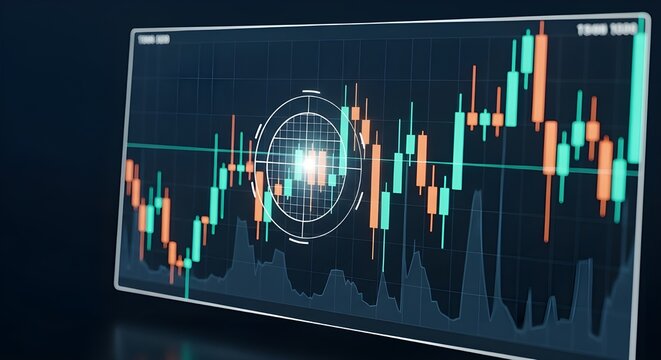
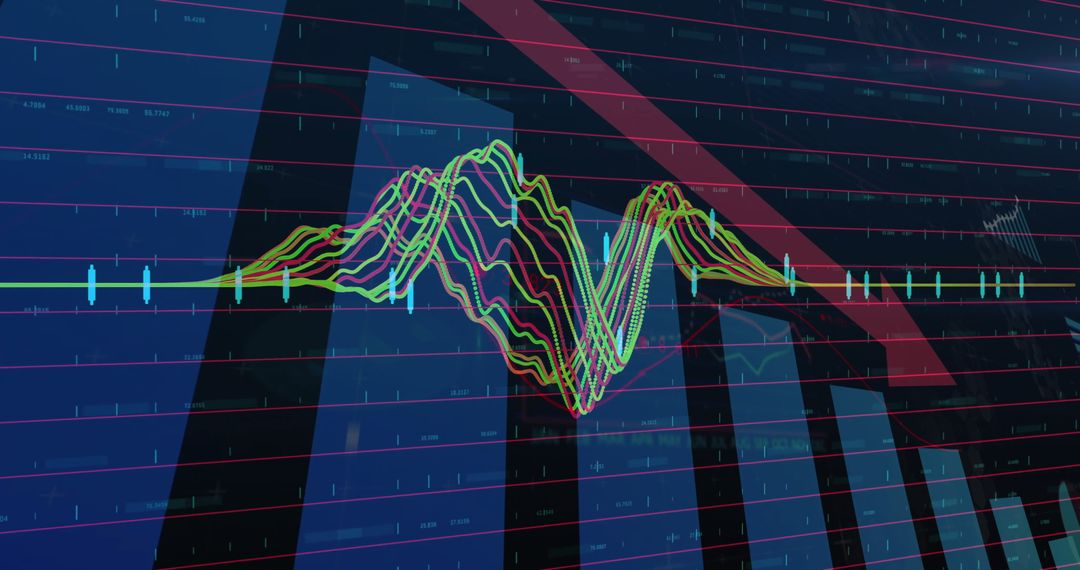
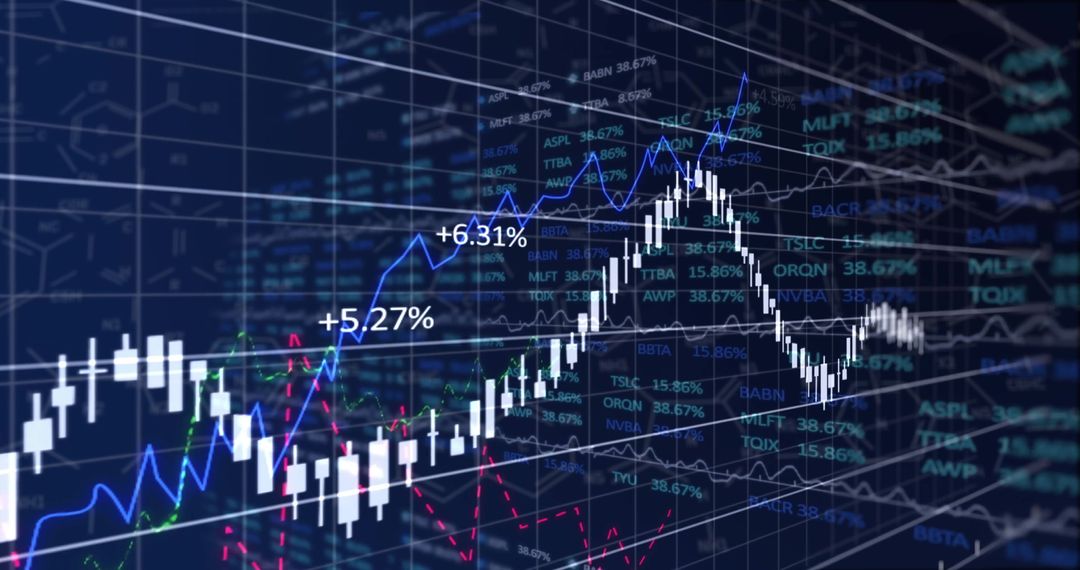
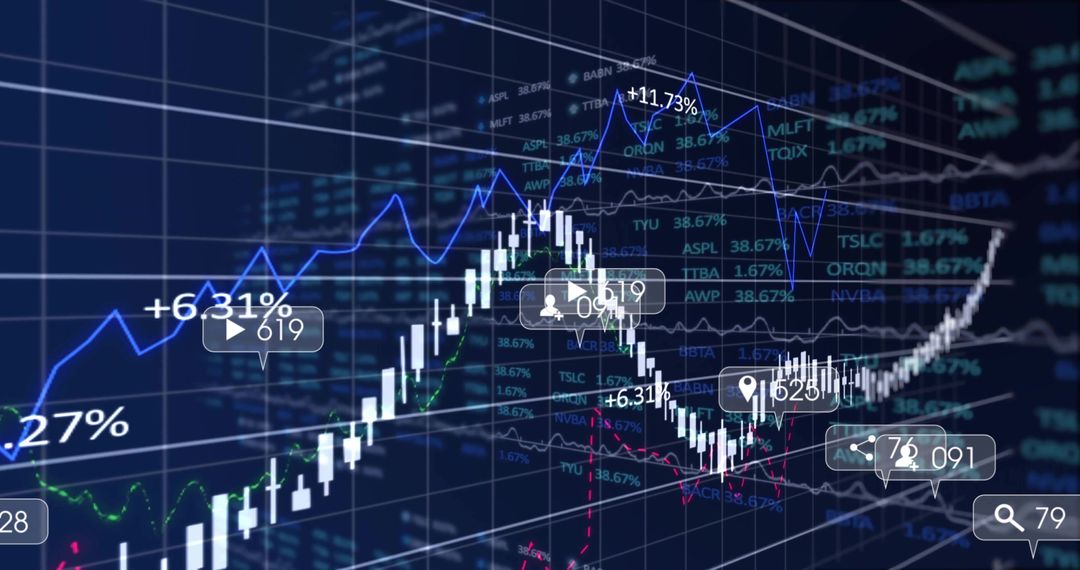
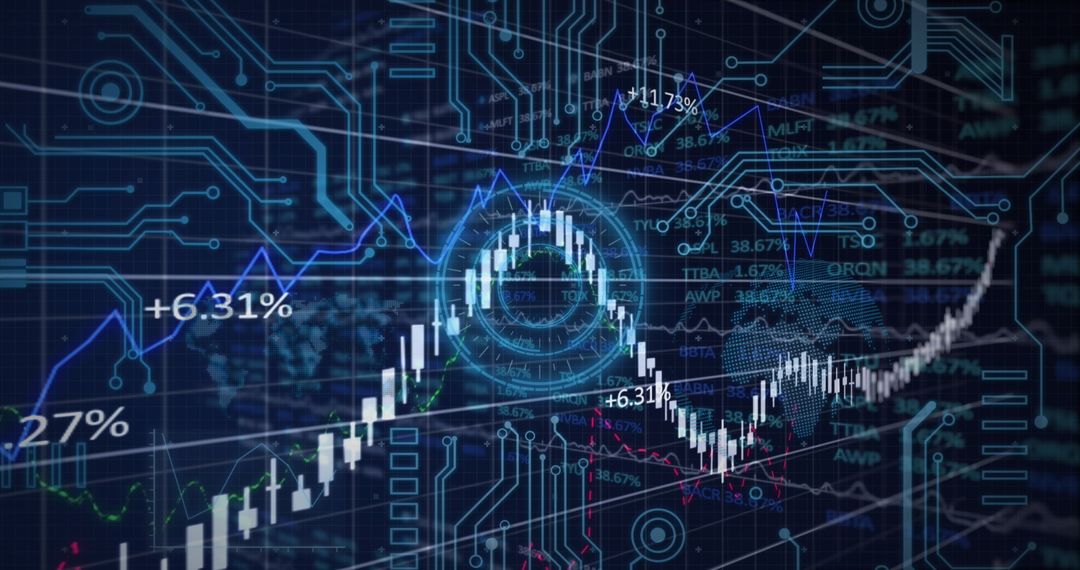
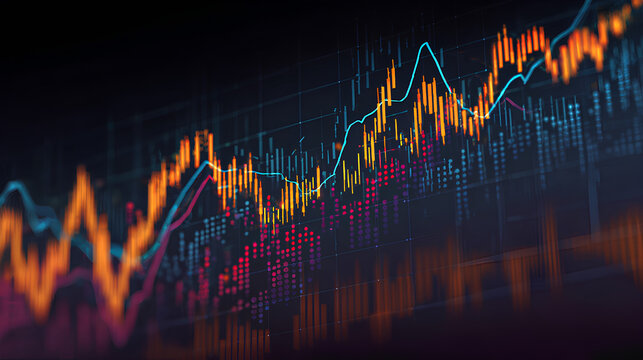
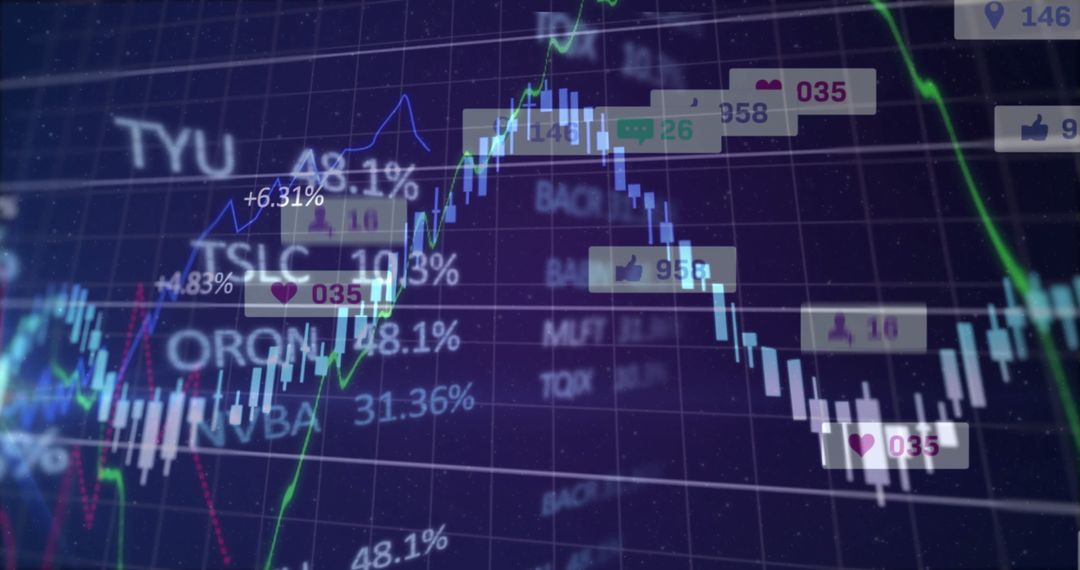
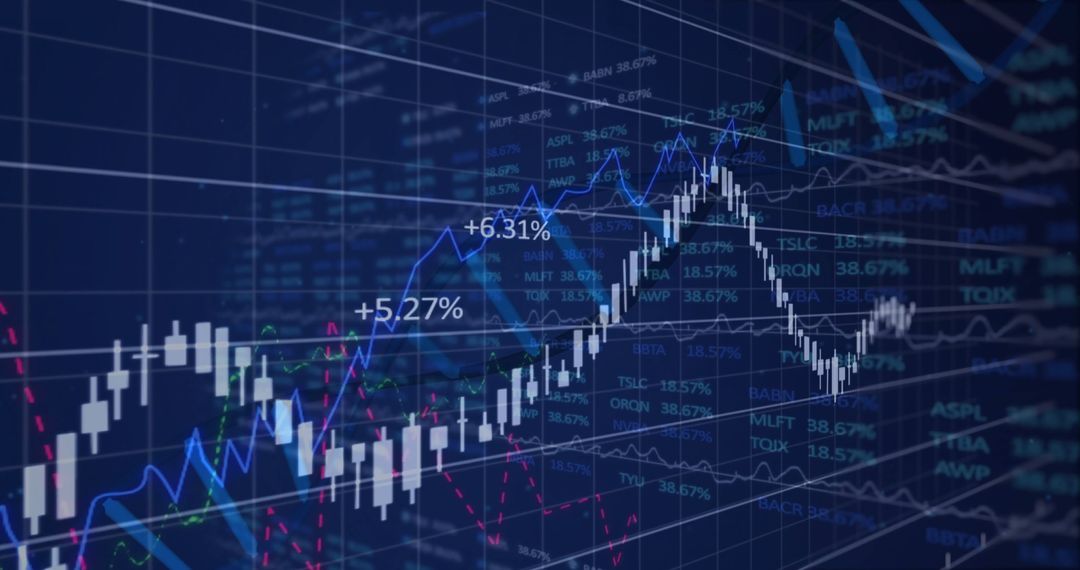
- Rising Candlestick Chart on Dynamic Digital Financial Display
Rising Candlestick Chart on Dynamic Digital Financial Display Image

This visual representation showcases a candlestick chart on a digital display platform, useful for illustrating financial analytics and market trends in publications or reports. Suitable for presentations related to investment strategies, stock market educations, or technology in trading systems.
Powered by 


0
downloads
downloads
Tags:
More
Credit Photo
If you would like to credit the Photo, here are some ways you can do so
Text Link
photo Link
<span class="text-link">
<span>
<a target="_blank" href=https://pikwizard.com/photo/rising-candlestick-chart-on-dynamic-digital-financial-display/e3f8096301cf321a5afd73154de1909b/>PikWizard</a>
</span>
</span>
<span class="image-link">
<span
style="margin: 0 0 20px 0; display: inline-block; vertical-align: middle; width: 100%;"
>
<a
target="_blank"
href="https://pikwizard.com/photo/rising-candlestick-chart-on-dynamic-digital-financial-display/e3f8096301cf321a5afd73154de1909b/"
style="text-decoration: none; font-size: 10px; margin: 0;"
>
<img src="https://pikwizard.com/pw/medium/e3f8096301cf321a5afd73154de1909b.jpg" style="margin: 0; width: 100%;" alt="" />
<p style="font-size: 12px; margin: 0;">PikWizard</p>
</a>
</span>
</span>
Free (free of charge)
Free for personal and commercial use.
Author: Awesome Content
Similar Free Stock Images

Premium


Premium


Premium


Premium


Premium


Premium


Premium


Premium


Premium


Premium


Premium


Premium


Premium


Premium


Premium


Premium


Premium


Premium


Premium


Premium


Premium


Premium


Premium


Premium