- Home >
- Stock Photos >
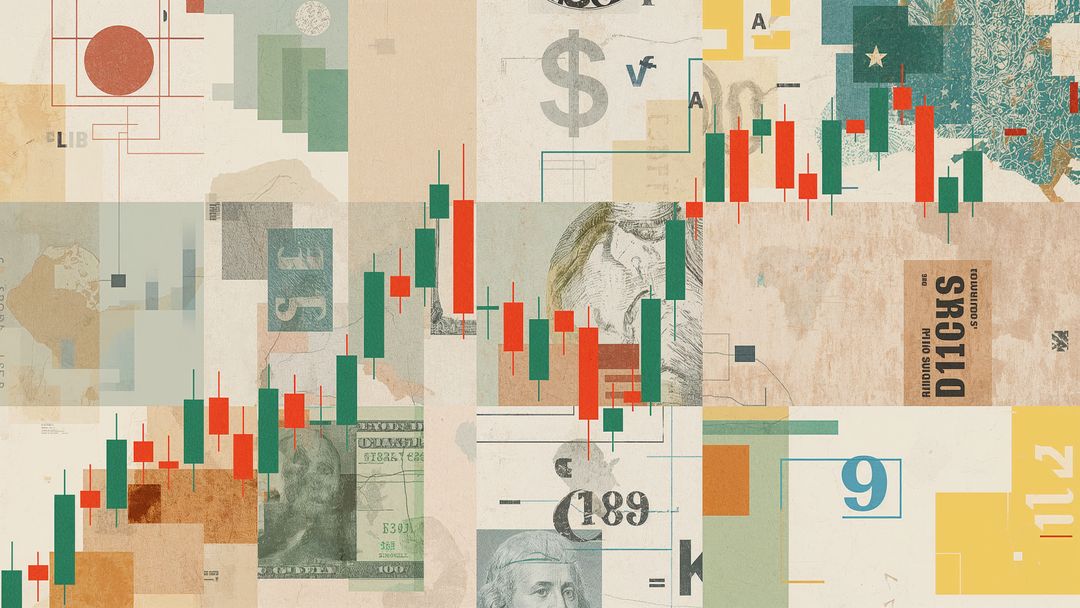
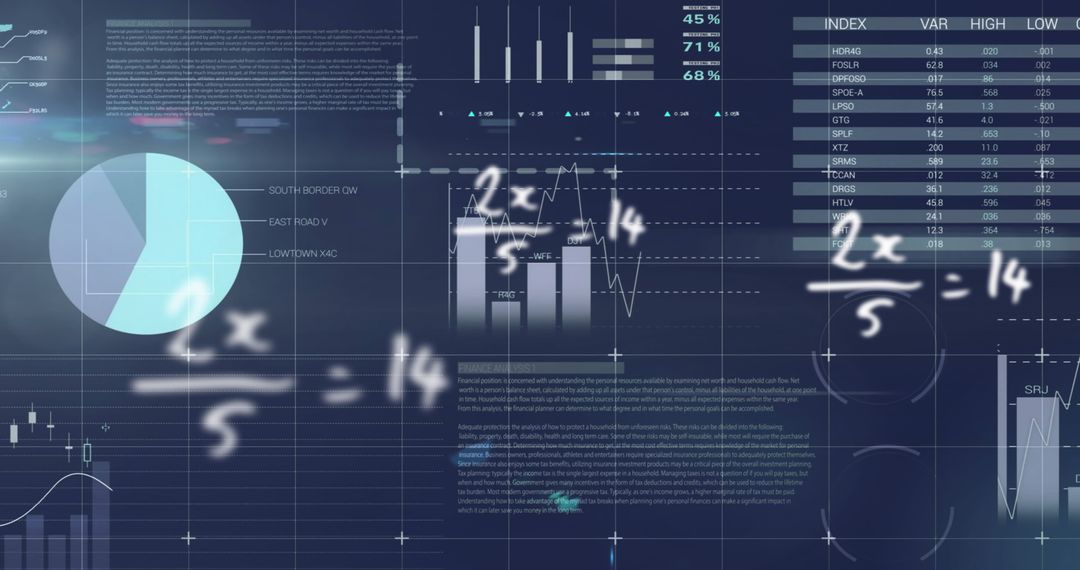
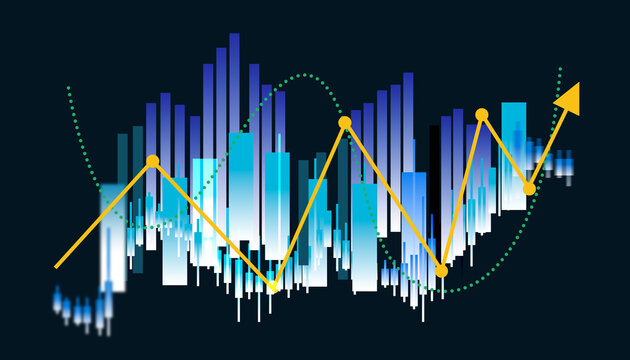
- Rising Candlestick Chart with Dollar Icons on Textured Grid
Rising Candlestick Chart with Dollar Icons on Textured Grid Image

AI Generated Image. Graphical representation of a candlestick chart, symbolizing rising financial trends with integrated dollar icons over a textured pastel grid. Ideal for illustrating articles on financial growth, investment strategies, stock market analysis, and economics in business reports or presentations.
Powered by 


0
downloads
downloads
Tags:
More
Credit Photo
If you would like to credit the Photo, here are some ways you can do so
Text Link
photo Link
<span class="text-link">
<span>
<a target="_blank" href=https://pikwizard.com/photo/rising-candlestick-chart-with-dollar-icons-on-textured-grid/888bd4085c1482c2d41161947c1fdbfd/>PikWizard</a>
</span>
</span>
<span class="image-link">
<span
style="margin: 0 0 20px 0; display: inline-block; vertical-align: middle; width: 100%;"
>
<a
target="_blank"
href="https://pikwizard.com/photo/rising-candlestick-chart-with-dollar-icons-on-textured-grid/888bd4085c1482c2d41161947c1fdbfd/"
style="text-decoration: none; font-size: 10px; margin: 0;"
>
<img src="https://pikwizard.com/pw/medium/888bd4085c1482c2d41161947c1fdbfd.jpg" style="margin: 0; width: 100%;" alt="" />
<p style="font-size: 12px; margin: 0;">PikWizard</p>
</a>
</span>
</span>
Free (free of charge)
Free for personal and commercial use.
Author: AI Creator
Similar Free Stock Images

Premium


Premium


Premium


Premium


Premium


Premium


Premium


Premium


Premium


Premium


Premium


Premium


Premium


Premium


Premium


Premium


Premium


Premium


Premium


Premium


Premium


Premium


Premium


Premium