- Home >
- Stock Photos >
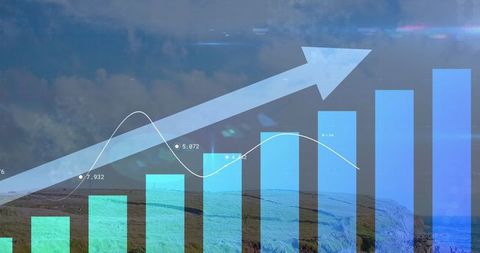
- Rising Data Analytics Bar Chart with Molecular Motifs
Rising Data Analytics Bar Chart with Molecular Motifs Image

Bar chart depicting rising data combines digital analytics with molecular motifs, displaying insights in technology. Useful for presentations on data growth in science and technology sectors. Applications in reports, digital projects, educational tools, and business infographics to illustrate data success and analytics visualization.

downloads
Tags:
More
Credit Photo
If you would like to credit the Photo, here are some ways you can do so
Text Link
photo Link
<span class="text-link">
<span>
<a target="_blank" href=https://pikwizard.com/photo/rising-data-analytics-bar-chart-with-molecular-motifs/871f52caae94a66e7a589e3ffe2f03db/>PikWizard</a>
</span>
</span>
<span class="image-link">
<span
style="margin: 0 0 20px 0; display: inline-block; vertical-align: middle; width: 100%;"
>
<a
target="_blank"
href="https://pikwizard.com/photo/rising-data-analytics-bar-chart-with-molecular-motifs/871f52caae94a66e7a589e3ffe2f03db/"
style="text-decoration: none; font-size: 10px; margin: 0;"
>
<img src="https://pikwizard.com/pw/medium/871f52caae94a66e7a589e3ffe2f03db.jpg" style="margin: 0; width: 100%;" alt="" />
<p style="font-size: 12px; margin: 0;">PikWizard</p>
</a>
</span>
</span>
Free (free of charge)
Free for personal and commercial use.
Author: Creative Art