- Home >
- Stock Photos >
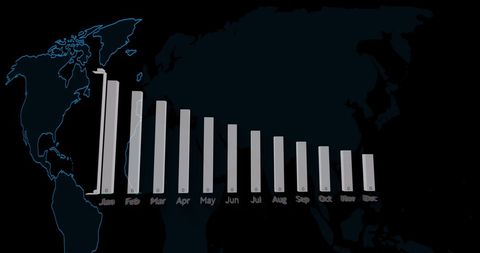
- Rising Data Charts Illustrating Growth Analytics
Rising Data Charts Illustrating Growth Analytics Image

Visual depiction of data rising with bar charts suited for illustrating business growth and analytics strategies. Ideal for presentations, reports, and technology-driven solutions discussions.
Powered by 


2
downloads
downloads
Tags:
More
Credit Photo
If you would like to credit the Photo, here are some ways you can do so
Text Link
photo Link
<span class="text-link">
<span>
<a target="_blank" href=https://pikwizard.com/photo/rising-data-charts-illustrating-growth-analytics/eb9139d4ea085967f43026773551b046/>PikWizard</a>
</span>
</span>
<span class="image-link">
<span
style="margin: 0 0 20px 0; display: inline-block; vertical-align: middle; width: 100%;"
>
<a
target="_blank"
href="https://pikwizard.com/photo/rising-data-charts-illustrating-growth-analytics/eb9139d4ea085967f43026773551b046/"
style="text-decoration: none; font-size: 10px; margin: 0;"
>
<img src="https://pikwizard.com/pw/medium/eb9139d4ea085967f43026773551b046.jpg" style="margin: 0; width: 100%;" alt="" />
<p style="font-size: 12px; margin: 0;">PikWizard</p>
</a>
</span>
</span>
Free (free of charge)
Free for personal and commercial use.
Author: People Creations
Similar Free Stock Images
Loading...


Premium


Premium

Premium

Premium


Premium


Premium


Premium


Premium

Premium


Premium


Premium


Premium


Premium


Premium

Premium


Premium


Premium


Premium


Premium


Premium


Premium


Premium

Premium


Premium


Premium