
- Home >
- Stock Photos >
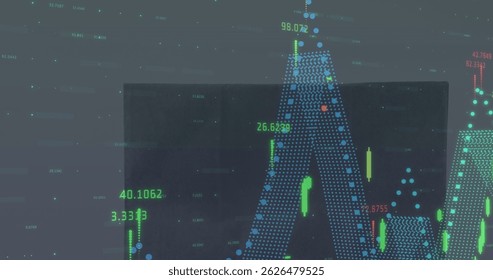
- Rising Digital Graph and Data Visualizations on Black Background
Rising Digital Graph and Data Visualizations on Black Background Image

This visual features a dynamic digital graph showing rising trends and data points against a black background, suggesting business growth or improvement in digital and financial sectors. The sharp lines and statistics offer a sense of technology-driven progress. Useful for online financial platforms, corporate presentations, or illustrating business analytics and market forecasting strategies.
Powered by  - Get 15% off with code: PIKWIZARD15


downloads
Tags:
More
Credit Photo
If you would like to credit the Photo, here are some ways you can do so
Text Link
photo Link
<span class="text-link">
<span>
<a target="_blank" href=https://pikwizard.com/photo/rising-digital-graph-and-data-visualizations-on-black-background/b139b6cd8c3a687bb38df04a5fc3223b/>PikWizard</a>
</span>
</span>
<span class="image-link">
<span
style="margin: 0 0 20px 0; display: inline-block; vertical-align: middle; width: 100%;"
>
<a
target="_blank"
href="https://pikwizard.com/photo/rising-digital-graph-and-data-visualizations-on-black-background/b139b6cd8c3a687bb38df04a5fc3223b/"
style="text-decoration: none; font-size: 10px; margin: 0;"
>
<img src="https://pikwizard.com/pw/medium/b139b6cd8c3a687bb38df04a5fc3223b.jpg" style="margin: 0; width: 100%;" alt="" />
<p style="font-size: 12px; margin: 0;">PikWizard</p>
</a>
</span>
</span>
Free (free of charge)
Free for personal and commercial use.
Author: Creative Art
Similar Free Stock Images

Premium


Premium

Premium


Premium


Premium


Premium


Premium


Premium

Premium

Premium

Premium


Premium


Premium


Premium


Premium


Premium


Premium


Premium


Premium


Premium

Premium


Premium


Premium


Premium


Premium

Explore More Free Stock Images