- Home >
- Stock Photos >
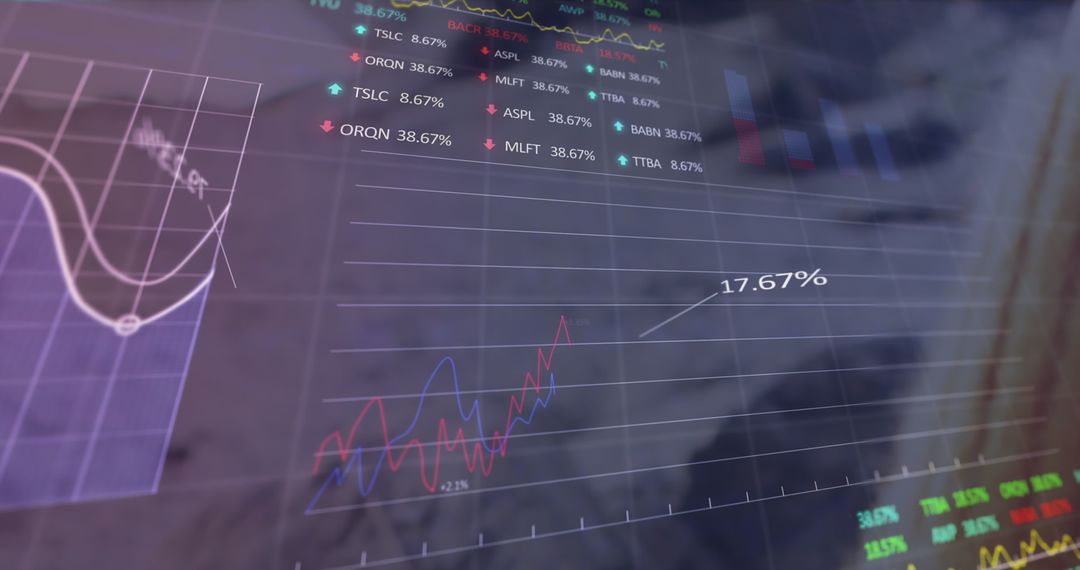
- Rising Earnings Chart on Digital Trading Screen with Cryptocurrency Tickers
Rising Earnings Chart on Digital Trading Screen with Cryptocurrency Tickers Image

Visual depiction of financial data trends and analytics useful for presentations on market analysis, investment strategies, or explaining cryptocurrency exchanges. Suitable for financial blogs, fintech tutorials, digital dashboards, or informational articles on statistics and technology. Highlights trends, enabling clear illustration of market movements.
Powered by  - Get 15% off with code: PIKWIZARD15


0
downloads
downloads
Tags:
More
Credit Photo
If you would like to credit the Photo, here are some ways you can do so
Text Link
photo Link
<span class="text-link">
<span>
<a target="_blank" href=https://pikwizard.com/photo/rising-earnings-chart-on-digital-trading-screen-with-cryptocurrency-tickers/712776ca039f6825fc084d38f8af76e4/>PikWizard</a>
</span>
</span>
<span class="image-link">
<span
style="margin: 0 0 20px 0; display: inline-block; vertical-align: middle; width: 100%;"
>
<a
target="_blank"
href="https://pikwizard.com/photo/rising-earnings-chart-on-digital-trading-screen-with-cryptocurrency-tickers/712776ca039f6825fc084d38f8af76e4/"
style="text-decoration: none; font-size: 10px; margin: 0;"
>
<img src="https://pikwizard.com/pw/medium/712776ca039f6825fc084d38f8af76e4.jpg" style="margin: 0; width: 100%;" alt="" />
<p style="font-size: 12px; margin: 0;">PikWizard</p>
</a>
</span>
</span>
Free (free of charge)
Free for personal and commercial use.
Author: Awesome Content
Similar Free Stock Images

Premium