- Home >
- Stock Photos >
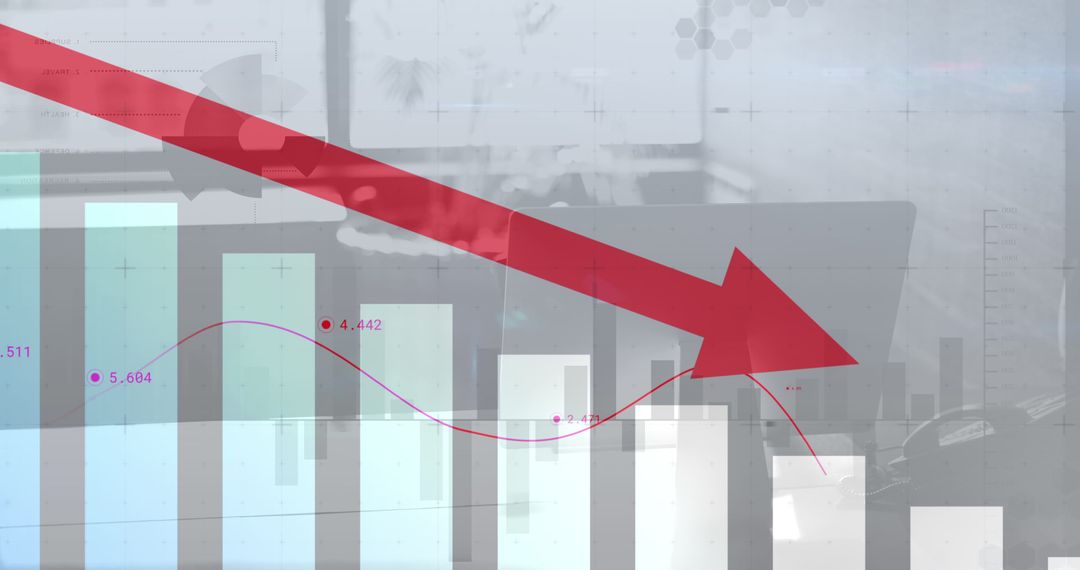
- Rising Financial Data Visualization with Arrow and Graphs
Rising Financial Data Visualization with Arrow and Graphs Image

Illustrates concepts like financial growth, market analysis, and economic trends. Effective for business presentations, financial reports, investment strategies, and educational materials showcasing market progression or data analytics.
Powered by 


0
downloads
downloads
Tags:
More
Credit Photo
If you would like to credit the Photo, here are some ways you can do so
Text Link
photo Link
<span class="text-link">
<span>
<a target="_blank" href=https://pikwizard.com/photo/rising-financial-data-visualization-with-arrow-and-graphs/9d9ed7132813da79fdef41ac80361753/>PikWizard</a>
</span>
</span>
<span class="image-link">
<span
style="margin: 0 0 20px 0; display: inline-block; vertical-align: middle; width: 100%;"
>
<a
target="_blank"
href="https://pikwizard.com/photo/rising-financial-data-visualization-with-arrow-and-graphs/9d9ed7132813da79fdef41ac80361753/"
style="text-decoration: none; font-size: 10px; margin: 0;"
>
<img src="https://pikwizard.com/pw/medium/9d9ed7132813da79fdef41ac80361753.jpg" style="margin: 0; width: 100%;" alt="" />
<p style="font-size: 12px; margin: 0;">PikWizard</p>
</a>
</span>
</span>
Free (free of charge)
Free for personal and commercial use.
Author: Authentic Images
Similar Free Stock Images

Premium


Premium


Premium


Premium


Premium


Premium


Premium


Premium


Premium


Premium


Premium


Premium


Premium


Premium


Premium


Premium


Premium


Premium


Premium


Premium


Premium


Premium


Premium


Premium