- Home >
- Stock Photos >
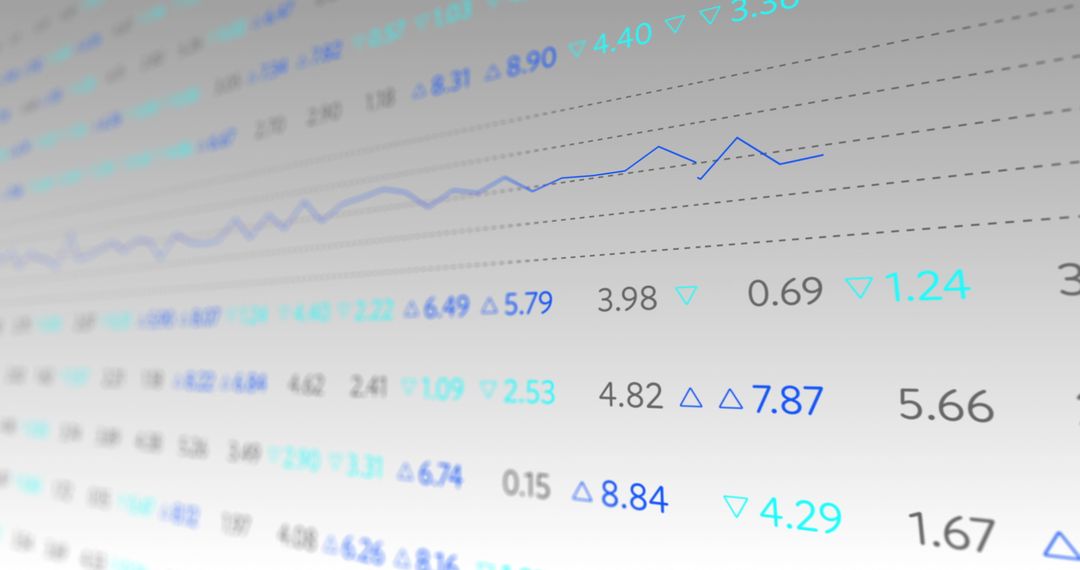
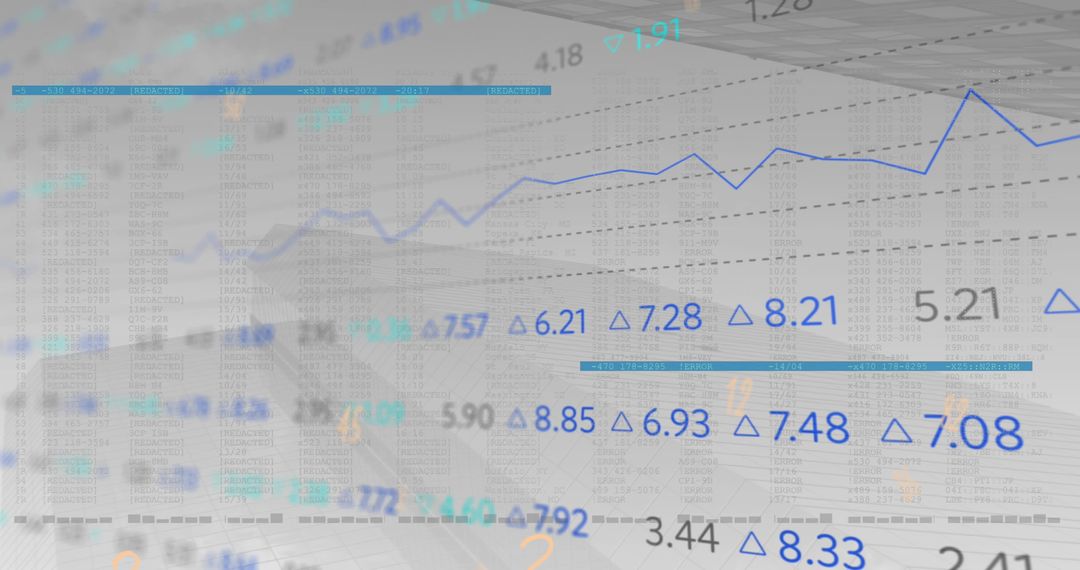
- Rising Financial Graph with Blue Tones Indicating Growth
Rising Financial Graph with Blue Tones Indicating Growth Image

This image of rising financial data and graphs in shades of blue indicates trends in stocks, business growth, or economic analysis. Useful for illustrating concepts related to digital finance, investment strategies, trading, economic news, and business analysis tools. Suitable for presentations and reports focused on financial progress and technology integration.
Powered by 


2
downloads
downloads
Tags:
More
Credit Photo
If you would like to credit the Photo, here are some ways you can do so
Text Link
photo Link
<span class="text-link">
<span>
<a target="_blank" href=https://pikwizard.com/photo/rising-financial-graph-with-blue-tones-indicating-growth/120891b15f395ab573657c943e4a66ce/>PikWizard</a>
</span>
</span>
<span class="image-link">
<span
style="margin: 0 0 20px 0; display: inline-block; vertical-align: middle; width: 100%;"
>
<a
target="_blank"
href="https://pikwizard.com/photo/rising-financial-graph-with-blue-tones-indicating-growth/120891b15f395ab573657c943e4a66ce/"
style="text-decoration: none; font-size: 10px; margin: 0;"
>
<img src="https://pikwizard.com/pw/medium/120891b15f395ab573657c943e4a66ce.jpg" style="margin: 0; width: 100%;" alt="" />
<p style="font-size: 12px; margin: 0;">PikWizard</p>
</a>
</span>
</span>
Free (free of charge)
Free for personal and commercial use.
Author: Authentic Images
Similar Free Stock Images
Premium


Premium


Premium


Premium


Premium


Premium


Premium


Premium


Premium


Premium


Premium


Premium


Premium


Premium


Premium


Premium


Premium


Premium


Premium


Premium


Premium


Premium


Premium


Premium