- Home >
- Stock Photos >
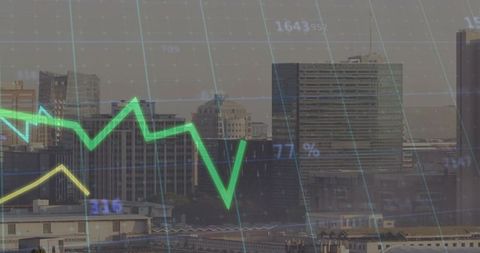
- Rising Financial Graphs Overlay on Urban Cityscape
Rising Financial Graphs Overlay on Urban Cityscape Image

Dynamic image of financial graphs and charts overlaying a modern cityscape illustrates concepts of global finance and economic trends. Suitable for use in financial news articles, business analytics blogs, or presentations on economic development and investment strategies.
Powered by 


2
downloads
downloads
Tags:
More
Credit Photo
If you would like to credit the Photo, here are some ways you can do so
Text Link
photo Link
<span class="text-link">
<span>
<a target="_blank" href=https://pikwizard.com/photo/rising-financial-graphs-overlay-on-urban-cityscape/ec1fe9bafd9cf9f3842e77f0f4f90594/>PikWizard</a>
</span>
</span>
<span class="image-link">
<span
style="margin: 0 0 20px 0; display: inline-block; vertical-align: middle; width: 100%;"
>
<a
target="_blank"
href="https://pikwizard.com/photo/rising-financial-graphs-overlay-on-urban-cityscape/ec1fe9bafd9cf9f3842e77f0f4f90594/"
style="text-decoration: none; font-size: 10px; margin: 0;"
>
<img src="https://pikwizard.com/pw/medium/ec1fe9bafd9cf9f3842e77f0f4f90594.jpg" style="margin: 0; width: 100%;" alt="" />
<p style="font-size: 12px; margin: 0;">PikWizard</p>
</a>
</span>
</span>
Free (free of charge)
Free for personal and commercial use.
Author: People Creations
Similar Free Stock Images
Loading...

Premium


Premium


Premium


Premium

Premium

Premium


Premium


Premium


Premium


Premium


Premium


Premium


Premium


Premium

Premium


Premium


Premium


Premium


Premium


Premium


Premium


Premium


Premium


Premium

Premium