- Home >
- Stock Photos >
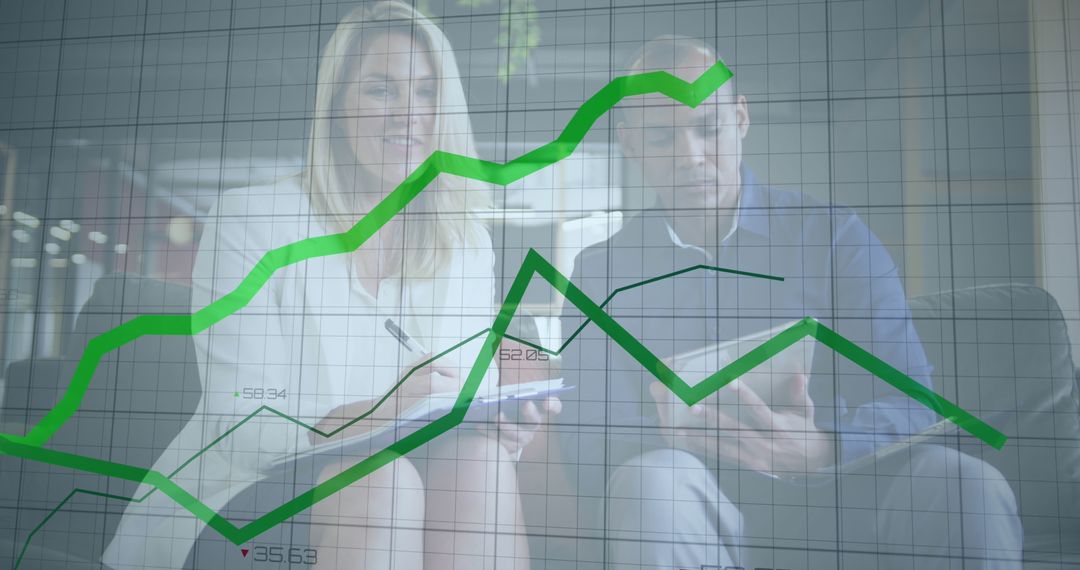
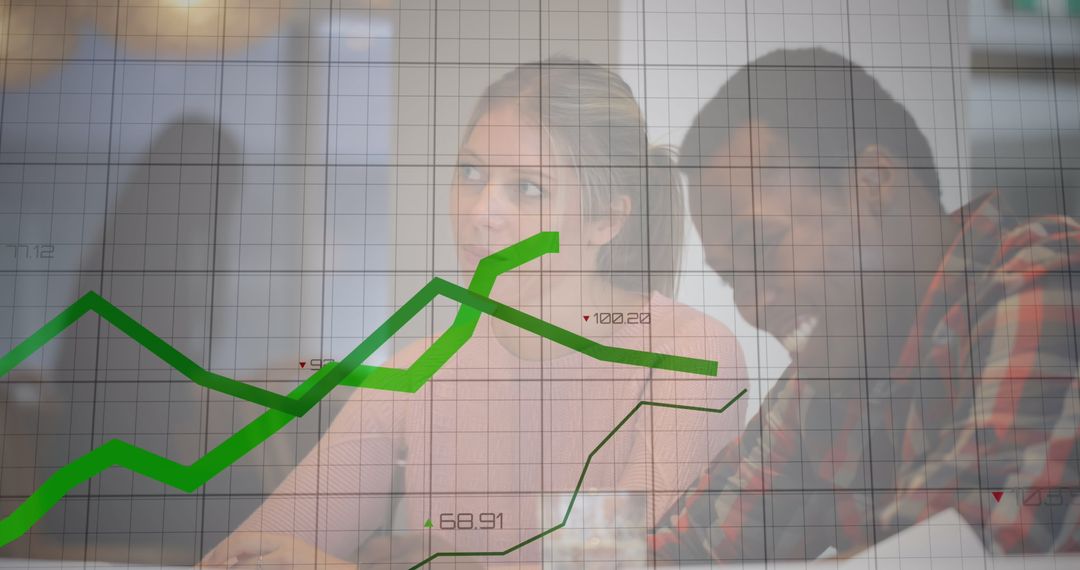
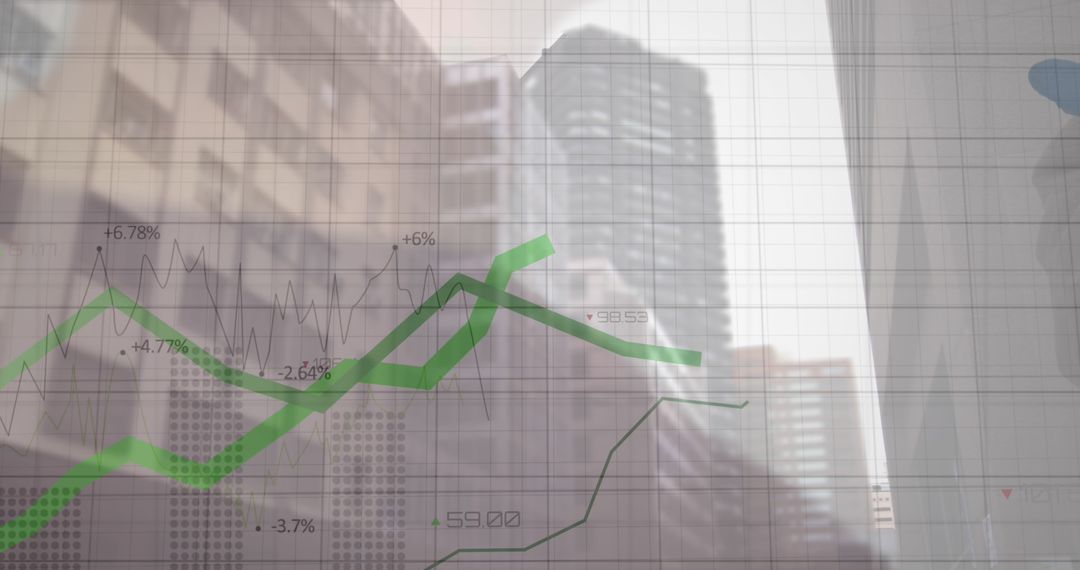
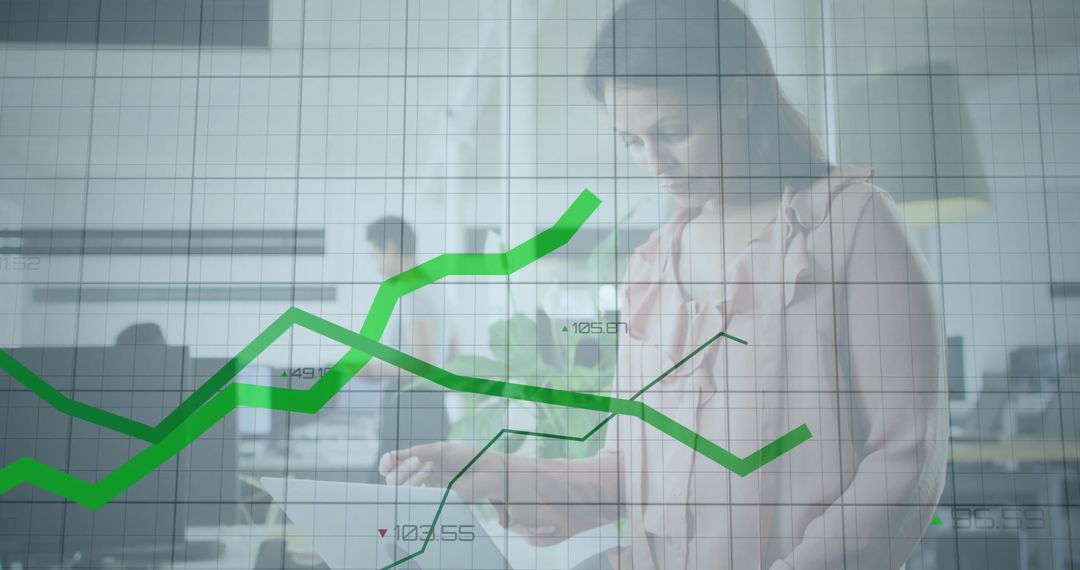
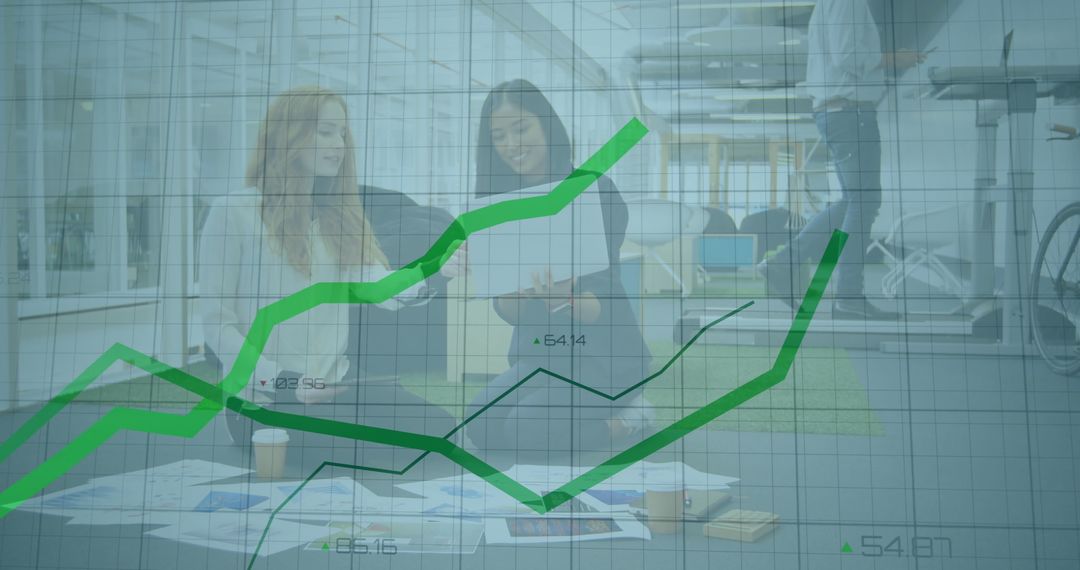
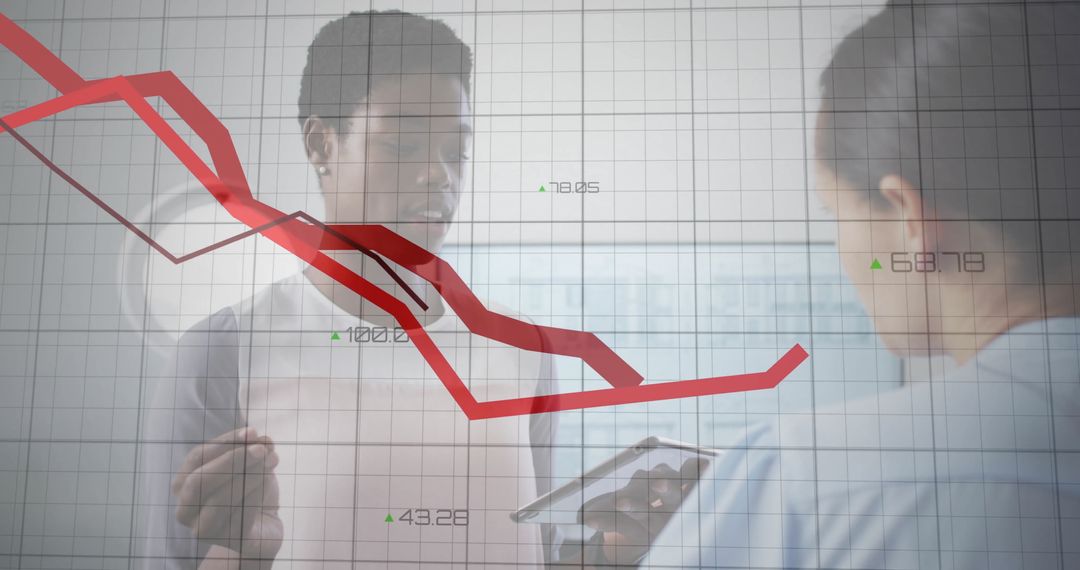
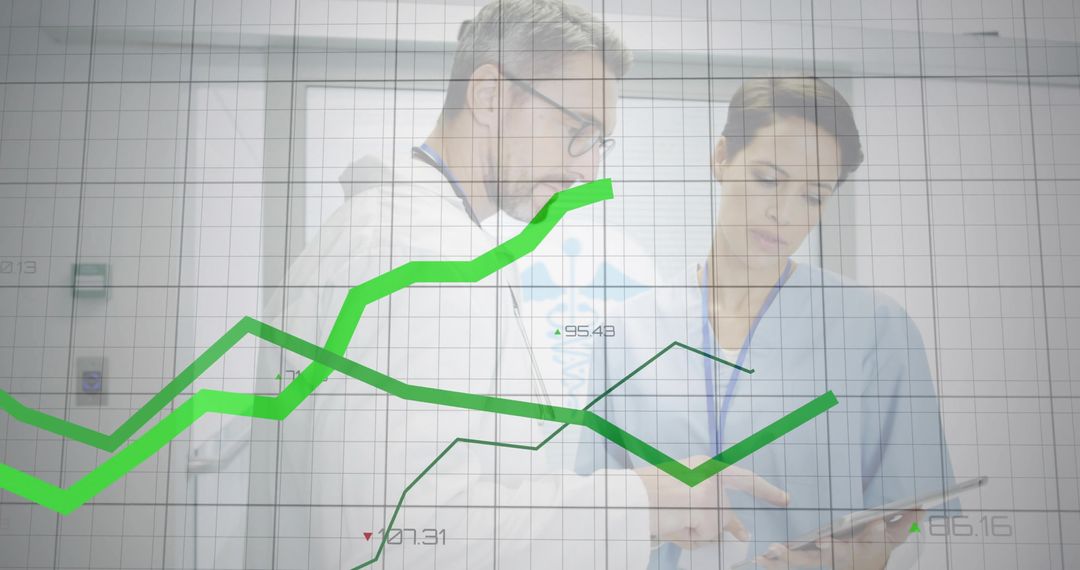
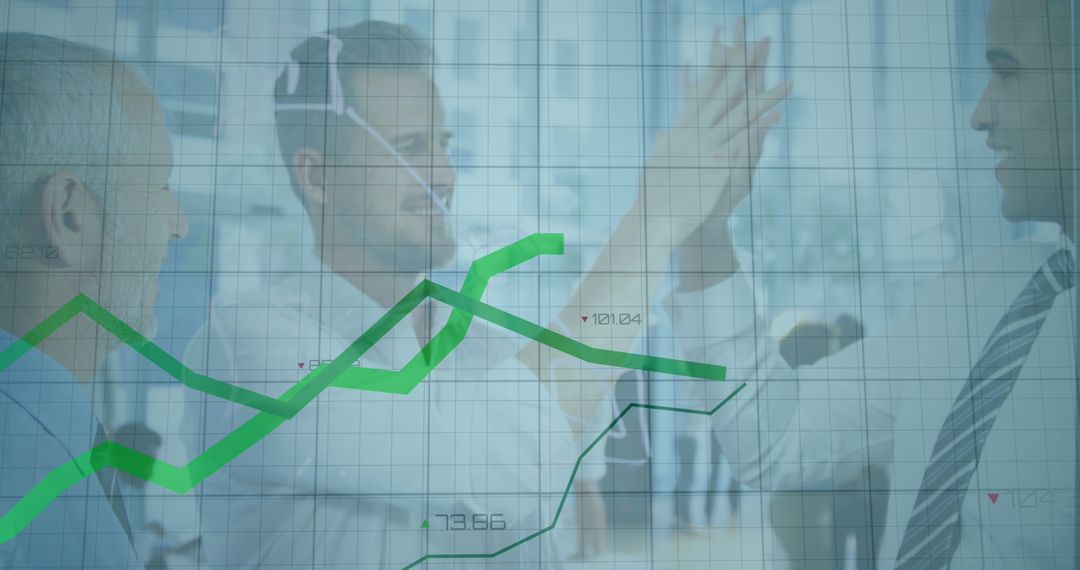
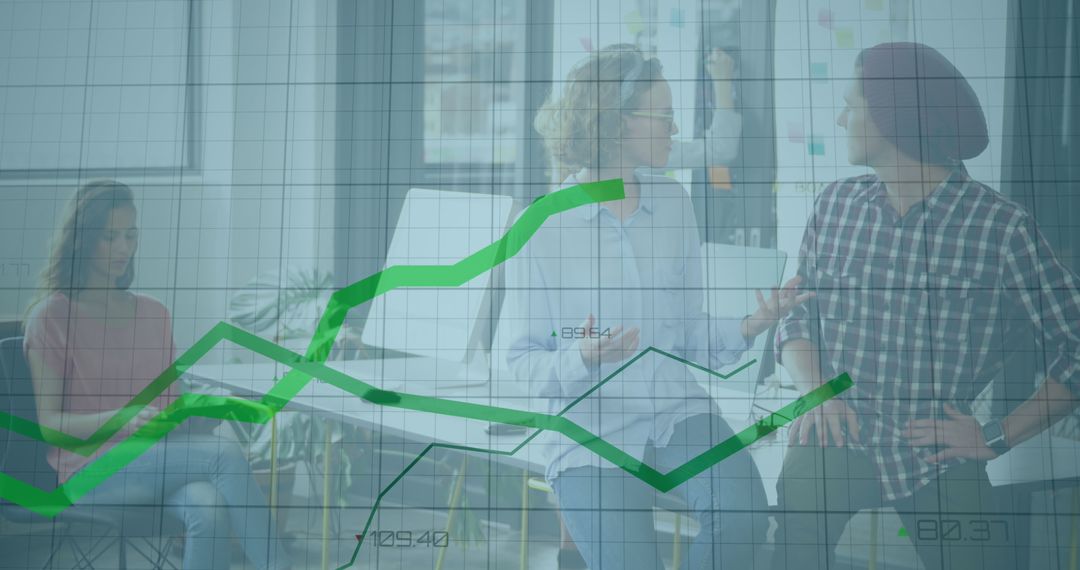
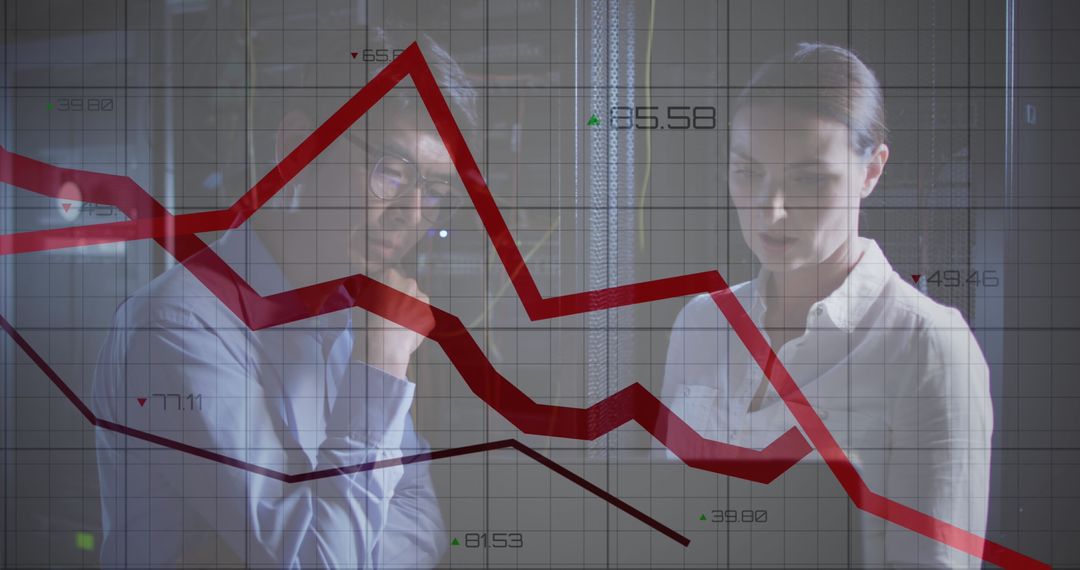
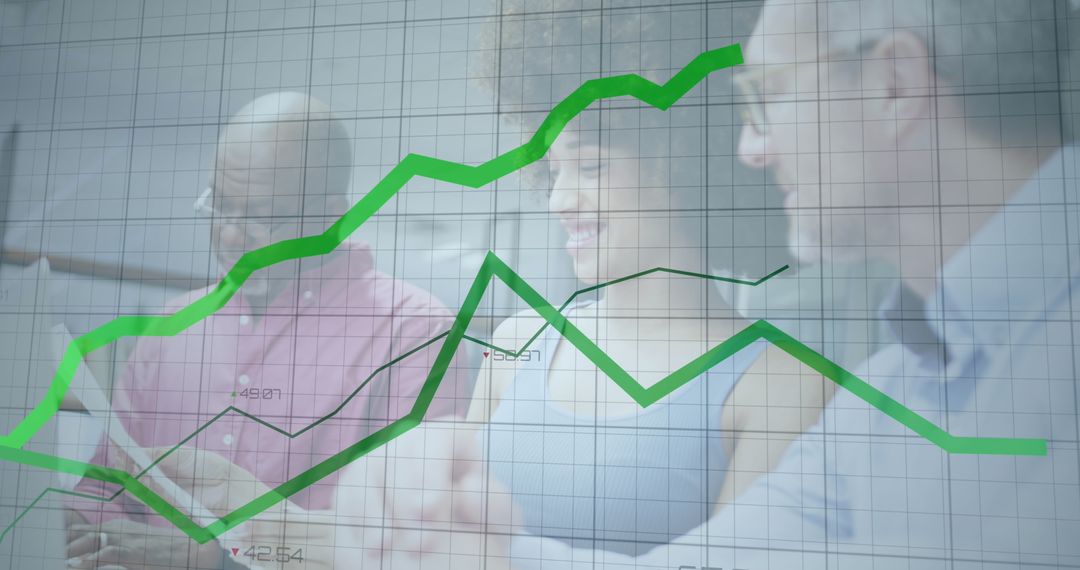
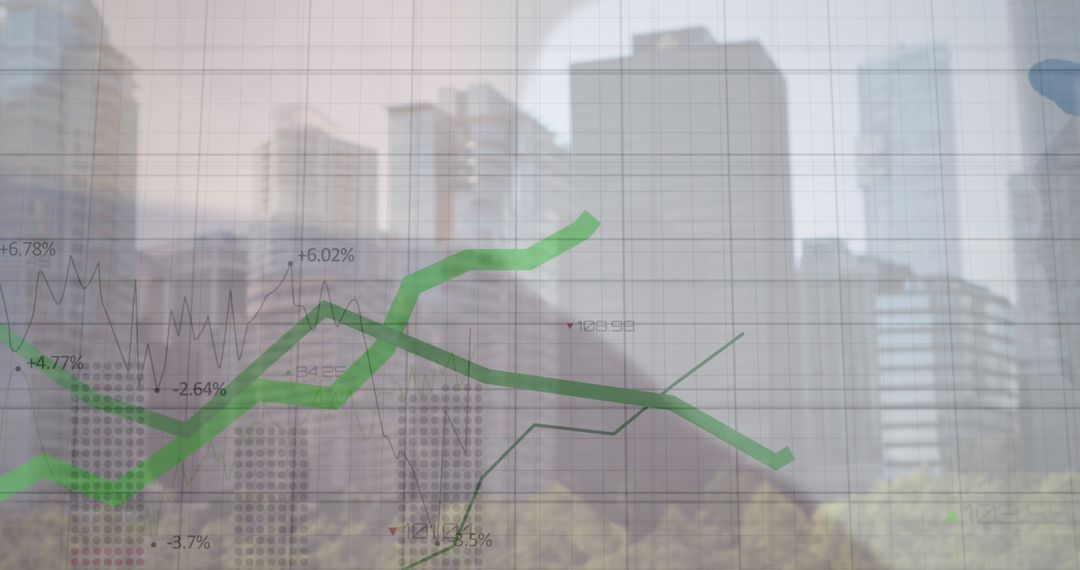
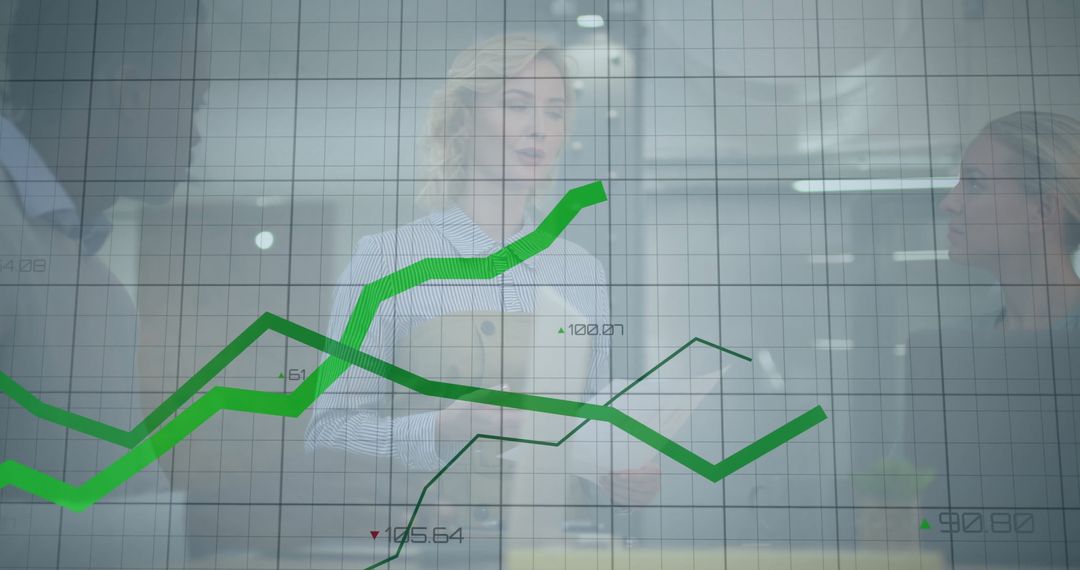
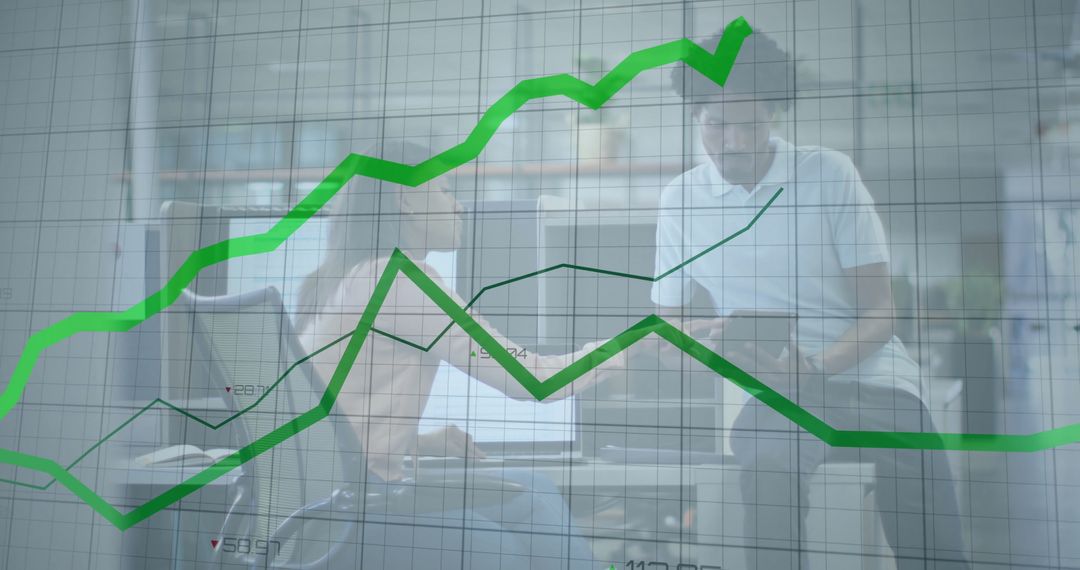
- Rising Financial Graphs with Hand Gesture Interaction
Rising Financial Graphs with Hand Gesture Interaction Image

Dynamic visualization depicting ascending graphs in vibrant green cutting through a digital grid. Hand gestures denote interactive data engagement, giving a futuristic insight into financial analysis and strategic planning. Perfect for illustrating economic growth, data analytics, or significant market trends in finance-focused media and digital content, enhancing thematic impact and modern design appeal.
Powered by 


2
downloads
downloads
Tags:
More
Credit Photo
If you would like to credit the Photo, here are some ways you can do so
Text Link
photo Link
<span class="text-link">
<span>
<a target="_blank" href=https://pikwizard.com/photo/rising-financial-graphs-with-hand-gesture-interaction/a95e612d1f8e896eccad7f39661f0389/>PikWizard</a>
</span>
</span>
<span class="image-link">
<span
style="margin: 0 0 20px 0; display: inline-block; vertical-align: middle; width: 100%;"
>
<a
target="_blank"
href="https://pikwizard.com/photo/rising-financial-graphs-with-hand-gesture-interaction/a95e612d1f8e896eccad7f39661f0389/"
style="text-decoration: none; font-size: 10px; margin: 0;"
>
<img src="https://pikwizard.com/pw/medium/a95e612d1f8e896eccad7f39661f0389.jpg" style="margin: 0; width: 100%;" alt="" />
<p style="font-size: 12px; margin: 0;">PikWizard</p>
</a>
</span>
</span>
Free (free of charge)
Free for personal and commercial use.
Author: Authentic Images
Similar Free Stock Images

Premium


Premium


Premium


Premium


Premium


Premium


Premium


Premium


Premium


Premium


Premium


Premium


Premium


Premium


Premium


Premium


Premium


Premium


Premium


Premium


Premium


Premium


Premium


Premium