
- Home >
- Stock Photos >
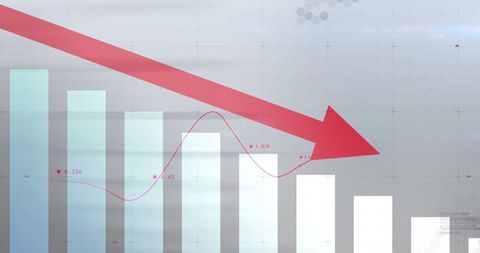
- Rising Financial Growth Chart with Arrow and Blue Bars
Rising Financial Growth Chart with Arrow and Blue Bars Image

A stylized representation of financial growth depicted with an arrow and bar graph against a digital cityscape background. This visual is perfect for presentations, financial reports, and marketing materials focused on economic progress, investment analysis, or data analytics. The upward arrow signifies positive trends in business, making it ideal for illustrating success stories or potential growth in various sectors.
Powered by  - Get 15% off with code: PIKWIZARD15


0
downloads
downloads
Tags:
More
Credit Photo
If you would like to credit the Photo, here are some ways you can do so
Text Link
photo Link
<span class="text-link">
<span>
<a target="_blank" href=https://pikwizard.com/photo/rising-financial-growth-chart-with-arrow-and-blue-bars/6156536bd21d540e111120d604bcc1a9/>PikWizard</a>
</span>
</span>
<span class="image-link">
<span
style="margin: 0 0 20px 0; display: inline-block; vertical-align: middle; width: 100%;"
>
<a
target="_blank"
href="https://pikwizard.com/photo/rising-financial-growth-chart-with-arrow-and-blue-bars/6156536bd21d540e111120d604bcc1a9/"
style="text-decoration: none; font-size: 10px; margin: 0;"
>
<img src="https://pikwizard.com/pw/medium/6156536bd21d540e111120d604bcc1a9.jpg" style="margin: 0; width: 100%;" alt="" />
<p style="font-size: 12px; margin: 0;">PikWizard</p>
</a>
</span>
</span>
Free (free of charge)
Free for personal and commercial use.
Author: Awesome Content
Similar Free Stock Images

Premium


Premium


Premium


Premium


Premium


Premium


Premium


Premium


Premium


Premium


Premium


Premium


Premium


Premium


Premium


Premium


Premium


Premium


Premium


Premium


Premium


Premium


Premium


Premium


Premium

