- Home >
- Stock Photos >
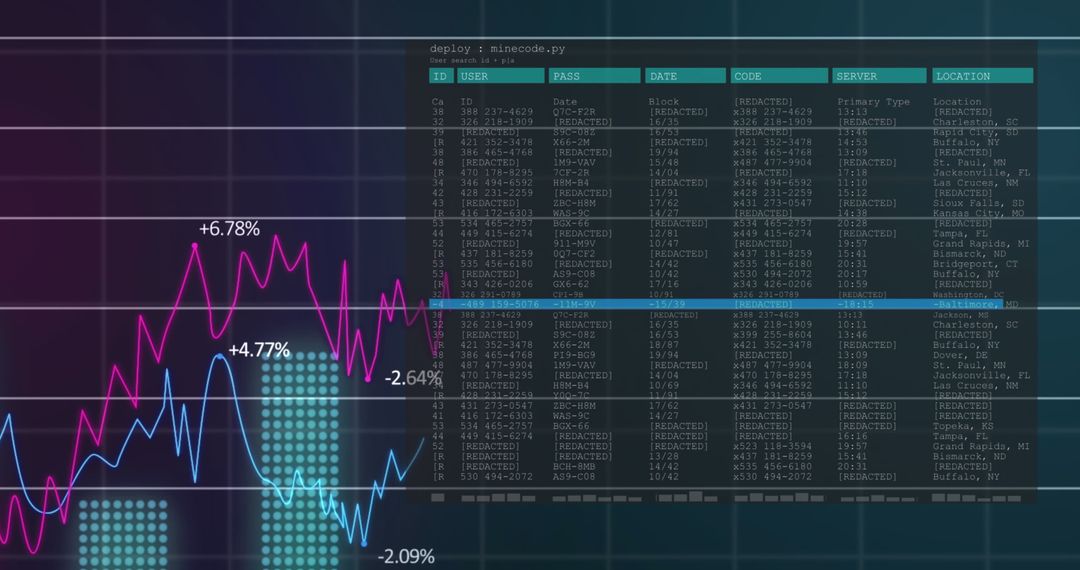
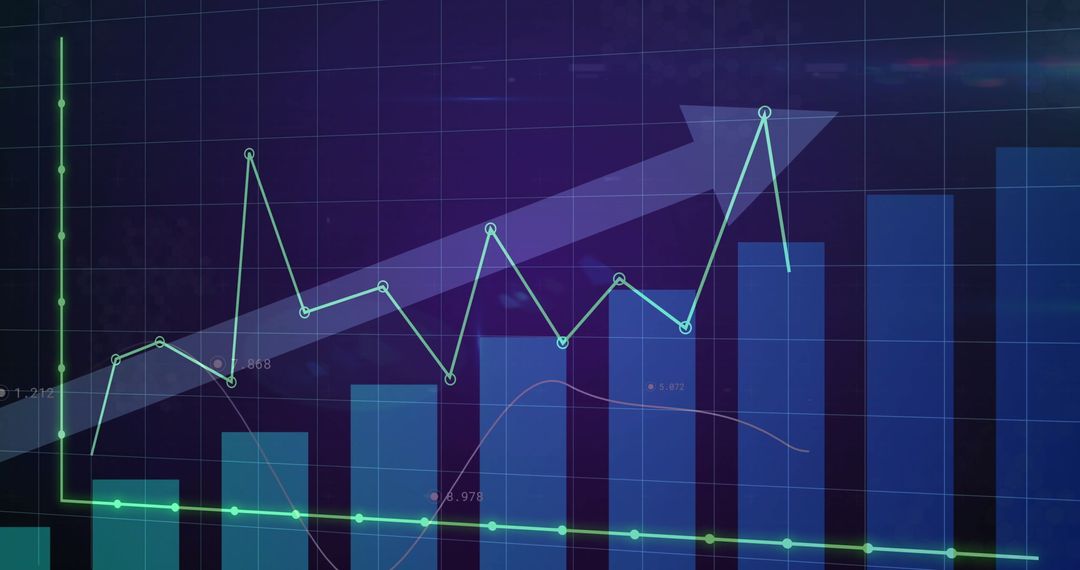
- Rising Financial Metrics on Digital Dashboard
Rising Financial Metrics on Digital Dashboard Image
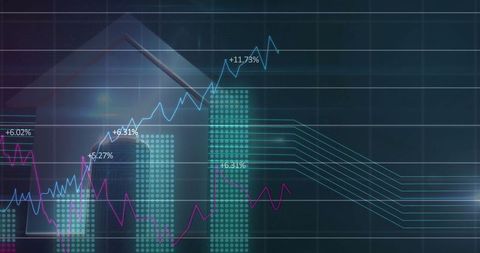
Illustrating digital data environment with arrows and bars representing financial analysis and growth, this visual suited for business reports, presentations on stock market and investment app promotions. Its design fits topics of modern economic trends and technology enhanced data interpretation.
Powered by  - Get 15% off with code: PIKWIZARD15


0
downloads
downloads
Tags:
More
Credit Photo
If you would like to credit the Photo, here are some ways you can do so
Text Link
photo Link
<span class="text-link">
<span>
<a target="_blank" href=https://pikwizard.com/photo/rising-financial-metrics-on-digital-dashboard/a253cfb24aa74564643f67eb1311aecf/>PikWizard</a>
</span>
</span>
<span class="image-link">
<span
style="margin: 0 0 20px 0; display: inline-block; vertical-align: middle; width: 100%;"
>
<a
target="_blank"
href="https://pikwizard.com/photo/rising-financial-metrics-on-digital-dashboard/a253cfb24aa74564643f67eb1311aecf/"
style="text-decoration: none; font-size: 10px; margin: 0;"
>
<img src="https://pikwizard.com/pw/medium/a253cfb24aa74564643f67eb1311aecf.jpg" style="margin: 0; width: 100%;" alt="" />
<p style="font-size: 12px; margin: 0;">PikWizard</p>
</a>
</span>
</span>
Free (free of charge)
Free for personal and commercial use.
Author: Awesome Content
Similar Free Stock Images

Premium


Premium


Premium


Premium


Premium


Premium


Premium


Premium


Premium


Premium


Premium


Premium


Premium


Premium


Premium


Premium


Premium


Premium


Premium


Premium


Premium


Premium


Premium


Premium