
- Home >
- Stock Photos >
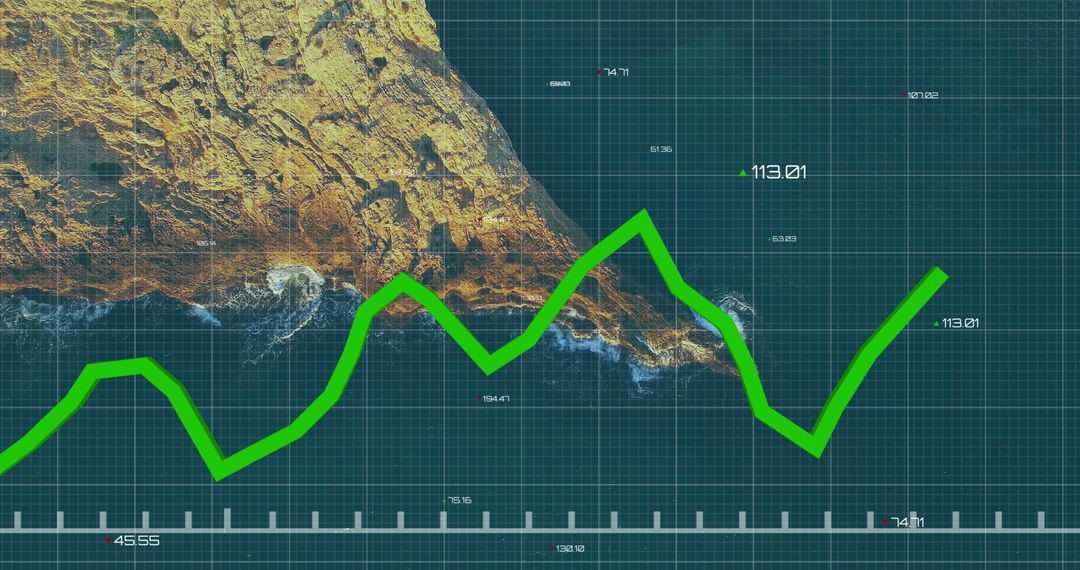
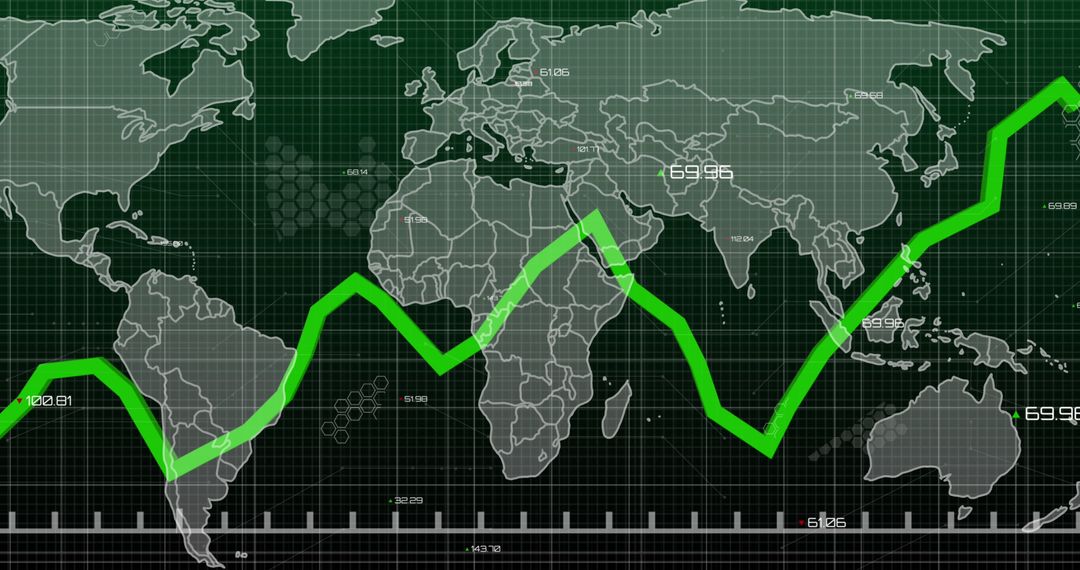
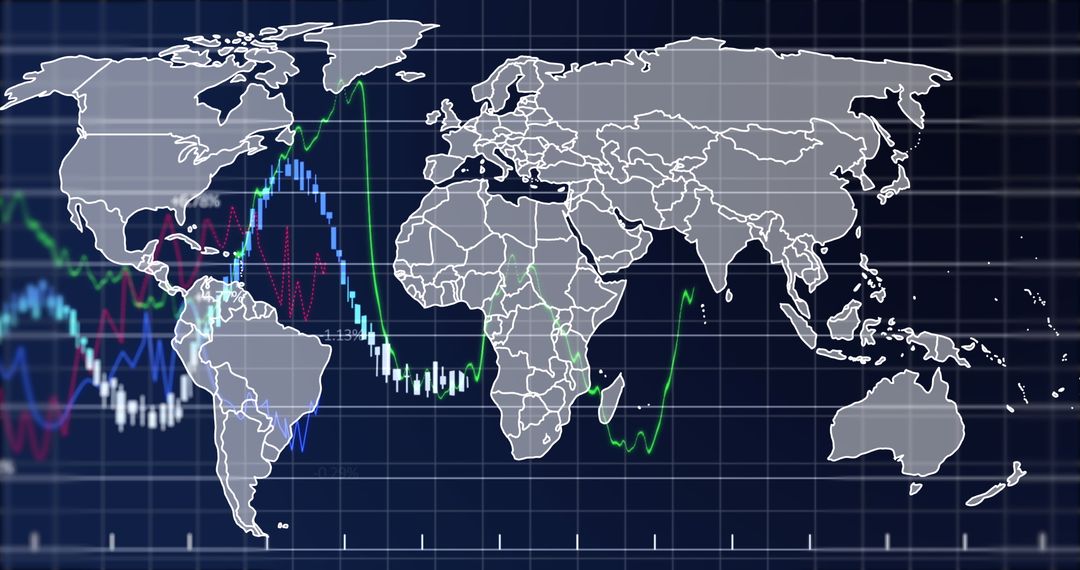
- Rising Global Business Trends and Data Analysis Abstract
Rising Global Business Trends and Data Analysis Abstract Image

Abstract representation of financial trends and global analysis showcases world map with green upward line. Suitable for representing concepts in business growth, economic forecasts, technology integration in financial sectors, stock market analysis, and international trade dynamics.
Powered by 


2
downloads
downloads
Tags:
More
Credit Photo
If you would like to credit the Photo, here are some ways you can do so
Text Link
photo Link
<span class="text-link">
<span>
<a target="_blank" href=https://pikwizard.com/photo/rising-global-business-trends-and-data-analysis-abstract/52f4942c8a487d52ae4079f9ad645ed8/>PikWizard</a>
</span>
</span>
<span class="image-link">
<span
style="margin: 0 0 20px 0; display: inline-block; vertical-align: middle; width: 100%;"
>
<a
target="_blank"
href="https://pikwizard.com/photo/rising-global-business-trends-and-data-analysis-abstract/52f4942c8a487d52ae4079f9ad645ed8/"
style="text-decoration: none; font-size: 10px; margin: 0;"
>
<img src="https://pikwizard.com/pw/medium/52f4942c8a487d52ae4079f9ad645ed8.jpg" style="margin: 0; width: 100%;" alt="" />
<p style="font-size: 12px; margin: 0;">PikWizard</p>
</a>
</span>
</span>
Free (free of charge)
Free for personal and commercial use.
Author: Authentic Images
Similar Free Stock Images

Premium


Premium


Premium


Premium


Premium


Premium


Premium


Premium


Premium


Premium


Premium


Premium


Premium


Premium


Premium


Premium


Premium


Premium


Premium


Premium


Premium


Premium


Premium


Premium

