
- Home >
- Stock Photos >
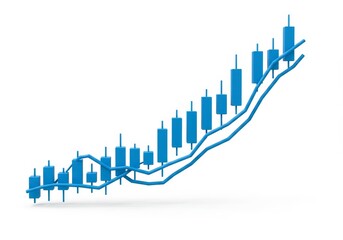
- Rising Graph with Data and Analysis Objects on Blue Background
Rising Graph with Data and Analysis Objects on Blue Background Image

Image depicting upward trending slogans are perfect for finance-related presentations, articles, or reports emphasizing growth and success. It can be used for educational material covering data analysis or infographics. Ideal in business contexts aiming to showcase productivity and achievement through visual data representation.
Powered by 


downloads
Tags:
More
Credit Photo
If you would like to credit the Photo, here are some ways you can do so
Text Link
photo Link
<span class="text-link">
<span>
<a target="_blank" href=https://pikwizard.com/photo/rising-graph-with-data-and-analysis-objects-on-blue-background/633033ccaa953db2207398a76f0d83b1/>PikWizard</a>
</span>
</span>
<span class="image-link">
<span
style="margin: 0 0 20px 0; display: inline-block; vertical-align: middle; width: 100%;"
>
<a
target="_blank"
href="https://pikwizard.com/photo/rising-graph-with-data-and-analysis-objects-on-blue-background/633033ccaa953db2207398a76f0d83b1/"
style="text-decoration: none; font-size: 10px; margin: 0;"
>
<img src="https://pikwizard.com/pw/medium/633033ccaa953db2207398a76f0d83b1.jpg" style="margin: 0; width: 100%;" alt="" />
<p style="font-size: 12px; margin: 0;">PikWizard</p>
</a>
</span>
</span>
Free (free of charge)
Free for personal and commercial use.
Author: People Creations
Similar Free Stock Images

Premium


Premium


Premium


Premium


Premium


Premium


Premium

Premium

Premium


Premium

Premium


Premium


Premium


Premium

Premium


Premium

Premium


Premium


Premium


Premium


Premium


Premium


Premium


Premium


Premium

Explore More Free Stock Images