- Home >
- Stock Photos >
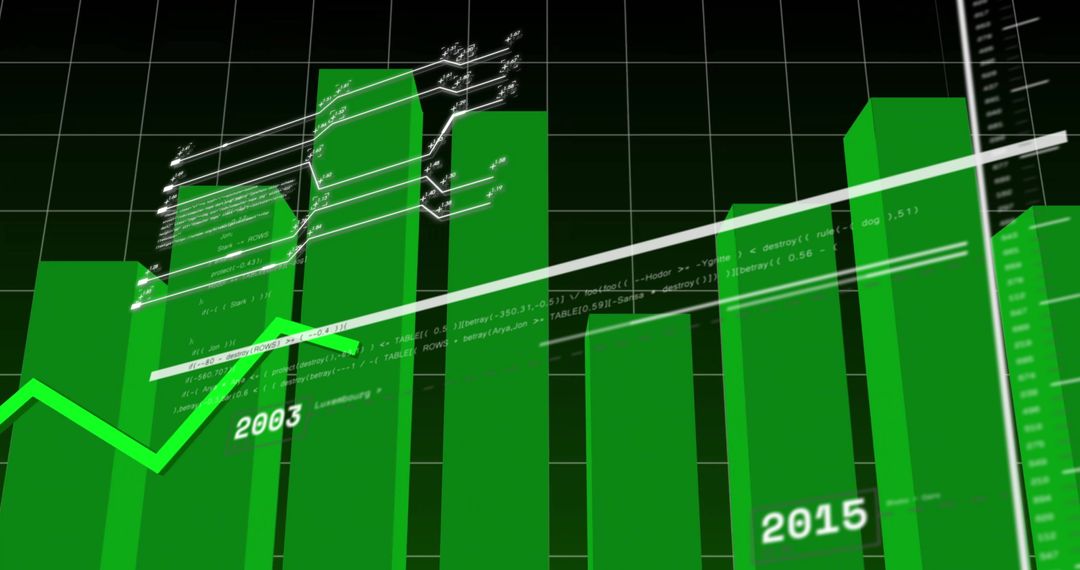
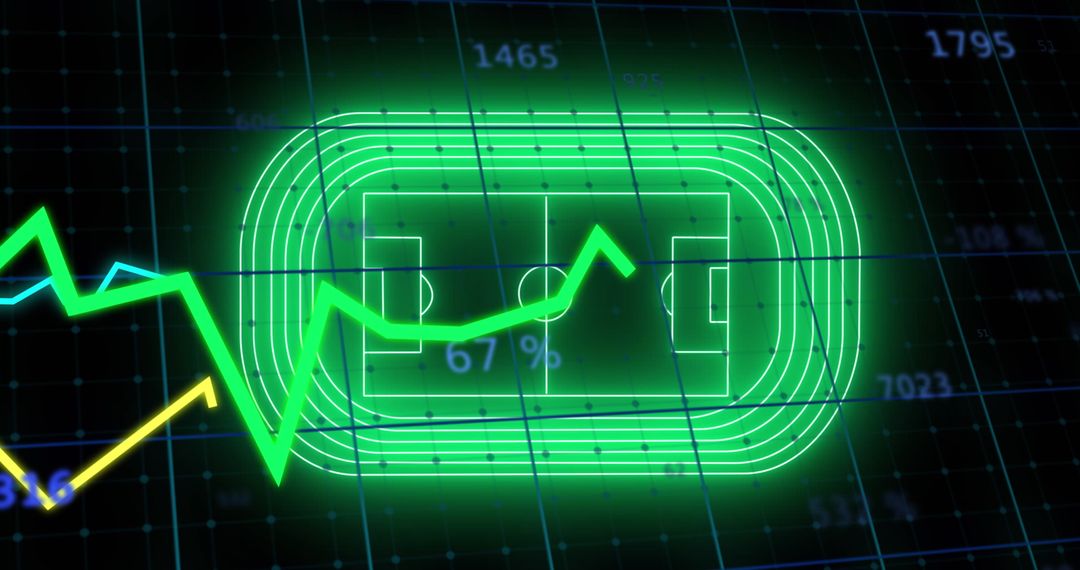
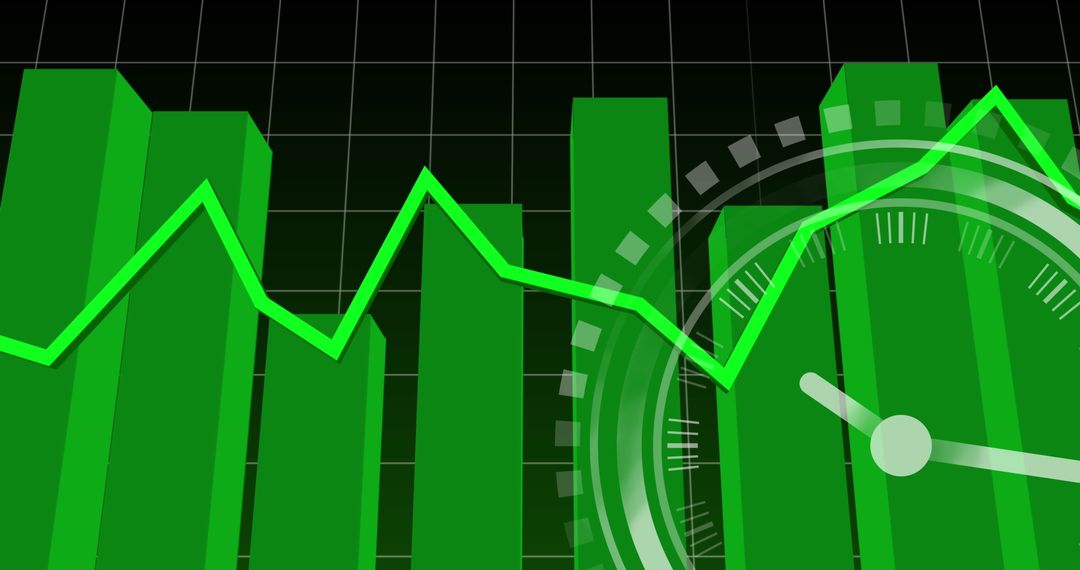
- Rising Green Bar Graph and Line Chart on Black Grid Background
Rising Green Bar Graph and Line Chart on Black Grid Background Image

Green bar graph and a rising line chart depicted on a dark grid background signify growth or positive trends in financial or business data. This illustration is ideal for business presentations, financial analysis documents, reports on market trends, or teaching materials about data analysis and growth forecasting.
Powered by 


2
downloads
downloads
Tags:
More
Credit Photo
If you would like to credit the Photo, here are some ways you can do so
Text Link
photo Link
<span class="text-link">
<span>
<a target="_blank" href=https://pikwizard.com/photo/rising-green-bar-graph-and-line-chart-on-black-grid-background/06757c77f4a4c65f36a445b0c56ec10d/>PikWizard</a>
</span>
</span>
<span class="image-link">
<span
style="margin: 0 0 20px 0; display: inline-block; vertical-align: middle; width: 100%;"
>
<a
target="_blank"
href="https://pikwizard.com/photo/rising-green-bar-graph-and-line-chart-on-black-grid-background/06757c77f4a4c65f36a445b0c56ec10d/"
style="text-decoration: none; font-size: 10px; margin: 0;"
>
<img src="https://pikwizard.com/pw/medium/06757c77f4a4c65f36a445b0c56ec10d.jpg" style="margin: 0; width: 100%;" alt="" />
<p style="font-size: 12px; margin: 0;">PikWizard</p>
</a>
</span>
</span>
Free (free of charge)
Free for personal and commercial use.
Author: People Creations
Similar Free Stock Images

Premium


Premium


Premium


Premium


Premium


Premium


Premium


Premium


Premium


Premium


Premium


Premium


Premium


Premium


Premium


Premium


Premium


Premium


Premium


Premium


Premium


Premium


Premium


Premium