- Home >
- Stock Photos >
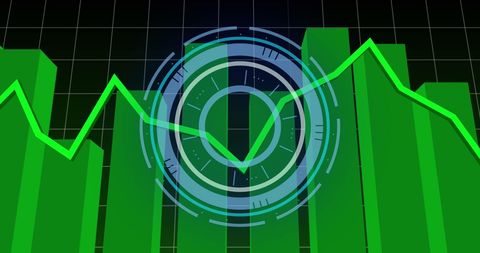
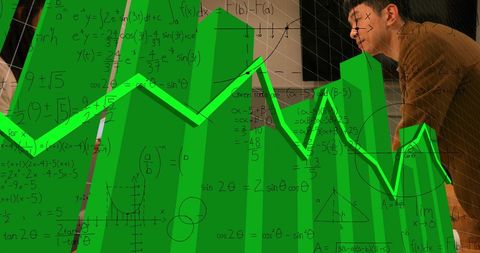
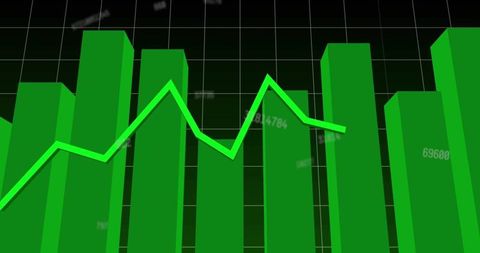
- Rising Green Bar Graph with Digital Grid Background
Rising Green Bar Graph with Digital Grid Background Image

This digitally generated visual shows a green line accompanying green bar graphs against a grid on a screen, symbolizing growth, data analytics, and financial trends. Ideal for illustrating concepts of economic improvement, financial forecasting, and statistical analysis in presentations or reports. Useful for marketing materials related to finance technology, investments, or business performance analytics.

downloads
Tags:
More
Credit Photo
If you would like to credit the Photo, here are some ways you can do so
Text Link
photo Link
<span class="text-link">
<span>
<a target="_blank" href=https://pikwizard.com/photo/rising-green-bar-graph-with-digital-grid-background/04e4866e37d1e3aa8dede7afccfca1be/>PikWizard</a>
</span>
</span>
<span class="image-link">
<span
style="margin: 0 0 20px 0; display: inline-block; vertical-align: middle; width: 100%;"
>
<a
target="_blank"
href="https://pikwizard.com/photo/rising-green-bar-graph-with-digital-grid-background/04e4866e37d1e3aa8dede7afccfca1be/"
style="text-decoration: none; font-size: 10px; margin: 0;"
>
<img src="https://pikwizard.com/pw/medium/04e4866e37d1e3aa8dede7afccfca1be.jpg" style="margin: 0; width: 100%;" alt="" />
<p style="font-size: 12px; margin: 0;">PikWizard</p>
</a>
</span>
</span>
Free (free of charge)
Free for personal and commercial use.
Author: Creative Art