
- Home >
- Stock Photos >
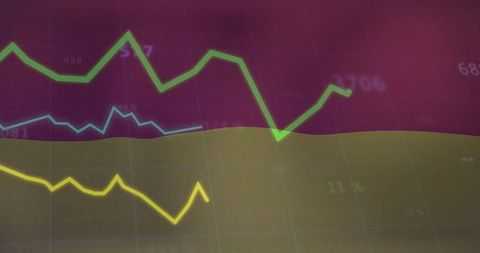
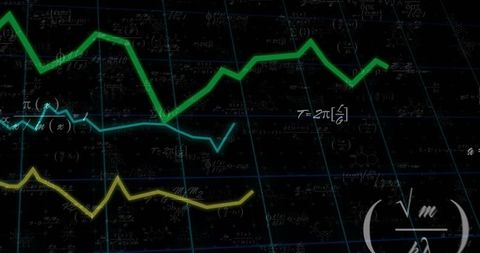
- Rising Green Financial Line Graph with Data Annotations
Rising Green Financial Line Graph with Data Annotations Image

Bright neon green line surges upward across the digital interface, symbolizing rising market trends. Accompanied by yellow line beneath anxiously tracing similar yet distinct pattern. Complemented by numbered references interspersed amidst overarching grid pattern overlay. Ideal usage in finance, investment reporting presentations, or illustrating positive stats or economic progress on website in visually compelling way.
Powered by  - Get 15% off with code: PIKWIZARD15


downloads
Tags:
More
Credit Photo
If you would like to credit the Photo, here are some ways you can do so
Text Link
photo Link
<span class="text-link">
<span>
<a target="_blank" href=https://pikwizard.com/photo/rising-green-financial-line-graph-with-data-annotations/f36bc4a13c09f67e9a55b2cad7f28e1f/>PikWizard</a>
</span>
</span>
<span class="image-link">
<span
style="margin: 0 0 20px 0; display: inline-block; vertical-align: middle; width: 100%;"
>
<a
target="_blank"
href="https://pikwizard.com/photo/rising-green-financial-line-graph-with-data-annotations/f36bc4a13c09f67e9a55b2cad7f28e1f/"
style="text-decoration: none; font-size: 10px; margin: 0;"
>
<img src="https://pikwizard.com/pw/medium/f36bc4a13c09f67e9a55b2cad7f28e1f.jpg" style="margin: 0; width: 100%;" alt="" />
<p style="font-size: 12px; margin: 0;">PikWizard</p>
</a>
</span>
</span>
Free (free of charge)
Free for personal and commercial use.
Author: Awesome Content
Similar Free Stock Images

Premium


Premium

Premium


Premium

Premium


Premium
Premium


Premium


Premium


Premium


Premium


Premium


Premium


Premium

Premium

Premium


Premium


Premium


Premium


Premium


Premium


Premium


Premium


Premium


Premium


Explore More Free Stock Images