- Home >
- Stock Photos >
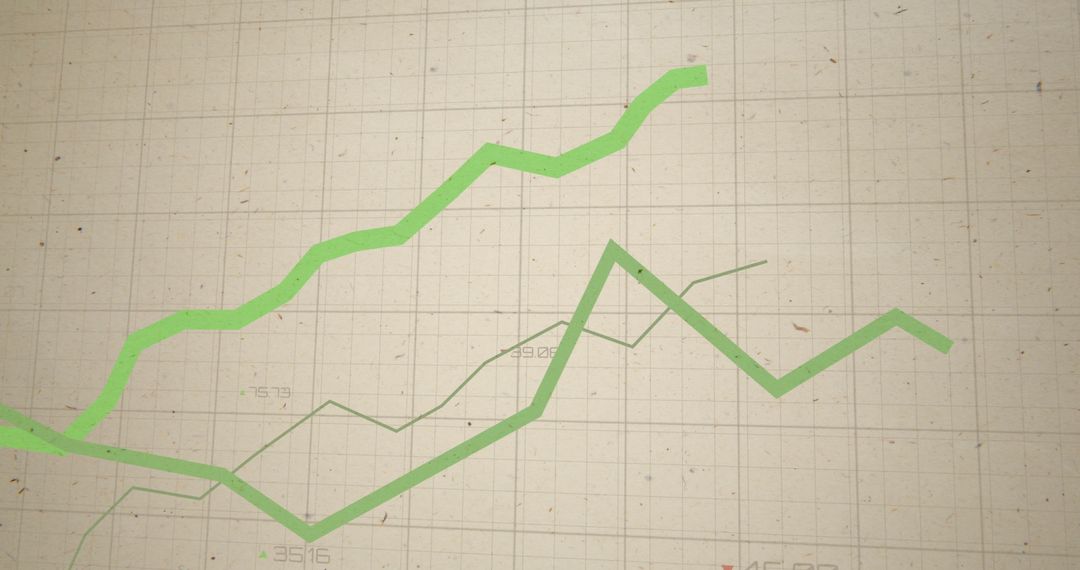
- Rising Green Graph on Financial Data Grid Background
Rising Green Graph on Financial Data Grid Background Image

Illustrative depiction of financial increase showing green been on data grid. It represents trends in business analytics and investment potentials. Suitable for content on economics, finance reports, and investment strategies. Use in presentations or articles on financial growth or market analysis for impactful visuals.
Powered by 


0
downloads
downloads
Tags:
More
Credit Photo
If you would like to credit the Photo, here are some ways you can do so
Text Link
photo Link
<span class="text-link">
<span>
<a target="_blank" href=https://pikwizard.com/photo/rising-green-graph-on-financial-data-grid-background/c68fe55b1be326952c887a59d330f9d6/>PikWizard</a>
</span>
</span>
<span class="image-link">
<span
style="margin: 0 0 20px 0; display: inline-block; vertical-align: middle; width: 100%;"
>
<a
target="_blank"
href="https://pikwizard.com/photo/rising-green-graph-on-financial-data-grid-background/c68fe55b1be326952c887a59d330f9d6/"
style="text-decoration: none; font-size: 10px; margin: 0;"
>
<img src="https://pikwizard.com/pw/medium/c68fe55b1be326952c887a59d330f9d6.jpg" style="margin: 0; width: 100%;" alt="" />
<p style="font-size: 12px; margin: 0;">PikWizard</p>
</a>
</span>
</span>
Free (free of charge)
Free for personal and commercial use.
Author: Authentic Images
Similar Free Stock Images

Premium


Premium


Premium


Premium


Premium


Premium


Premium


Premium


Premium


Premium


Premium


Premium


Premium


Premium


Premium


Premium


Premium


Premium


Premium


Premium


Premium


Premium


Premium


Premium