
- Home >
- Stock Photos >
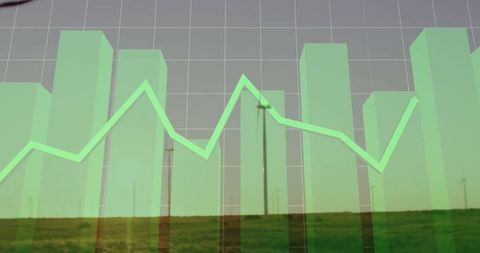
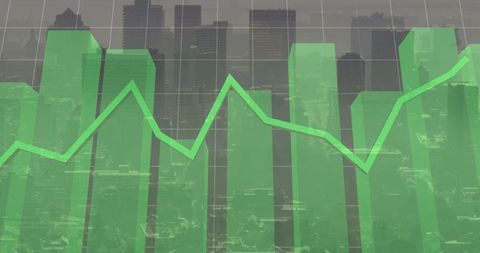
- Rising Green Graph with Fluctuating Statistical Line
Rising Green Graph with Fluctuating Statistical Line Image

Displaying a rising green graph and fluctuating line over grid, symbolizing financial growth and business trends in digital analytics. Useful for illustrating economic reports, business presentations on market analysis, financial predictions or educational materials focused on statistics and data analytics.
Powered by  - Get 15% off with code: PIKWIZARD15


downloads
Tags:
More
Credit Photo
If you would like to credit the Photo, here are some ways you can do so
Text Link
photo Link
<span class="text-link">
<span>
<a target="_blank" href=https://pikwizard.com/photo/rising-green-graph-with-fluctuating-statistical-line/4bb44eb238942fdb96c1bfd941deaf4d/>PikWizard</a>
</span>
</span>
<span class="image-link">
<span
style="margin: 0 0 20px 0; display: inline-block; vertical-align: middle; width: 100%;"
>
<a
target="_blank"
href="https://pikwizard.com/photo/rising-green-graph-with-fluctuating-statistical-line/4bb44eb238942fdb96c1bfd941deaf4d/"
style="text-decoration: none; font-size: 10px; margin: 0;"
>
<img src="https://pikwizard.com/pw/medium/4bb44eb238942fdb96c1bfd941deaf4d.jpg" style="margin: 0; width: 100%;" alt="" />
<p style="font-size: 12px; margin: 0;">PikWizard</p>
</a>
</span>
</span>
Free (free of charge)
Free for personal and commercial use.
Author: Creative Art
Similar Free Stock Images

Premium


Premium


Premium


Premium


Premium

Premium


Premium


Premium

Premium

Premium
Premium


Premium

Premium

Premium


Premium

Premium


Premium


Premium


Premium


Premium


Premium


Premium

Premium

Premium

Premium


Explore More Free Stock Images