- Home >
- Stock Photos >
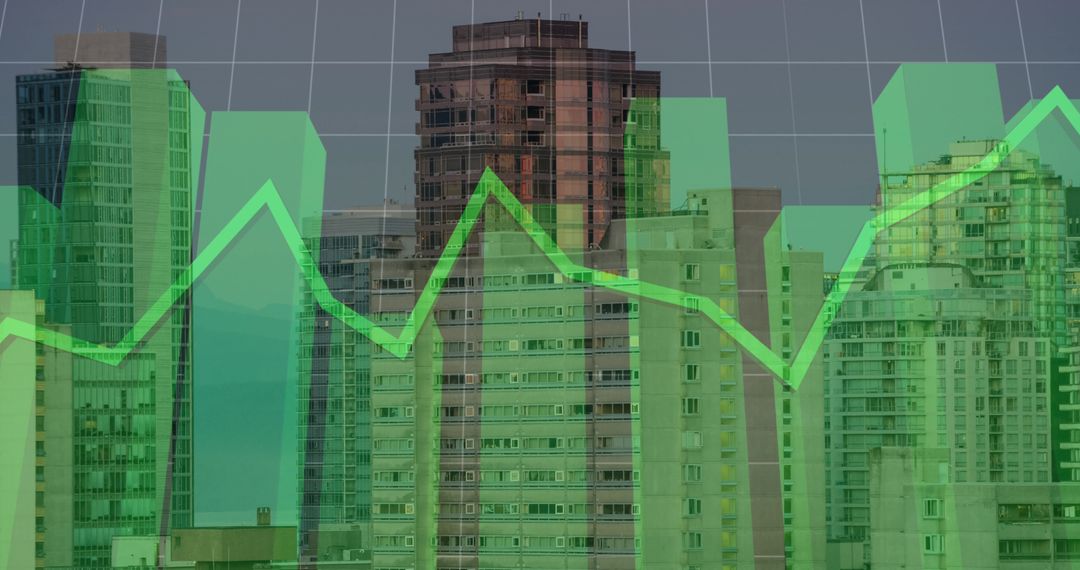
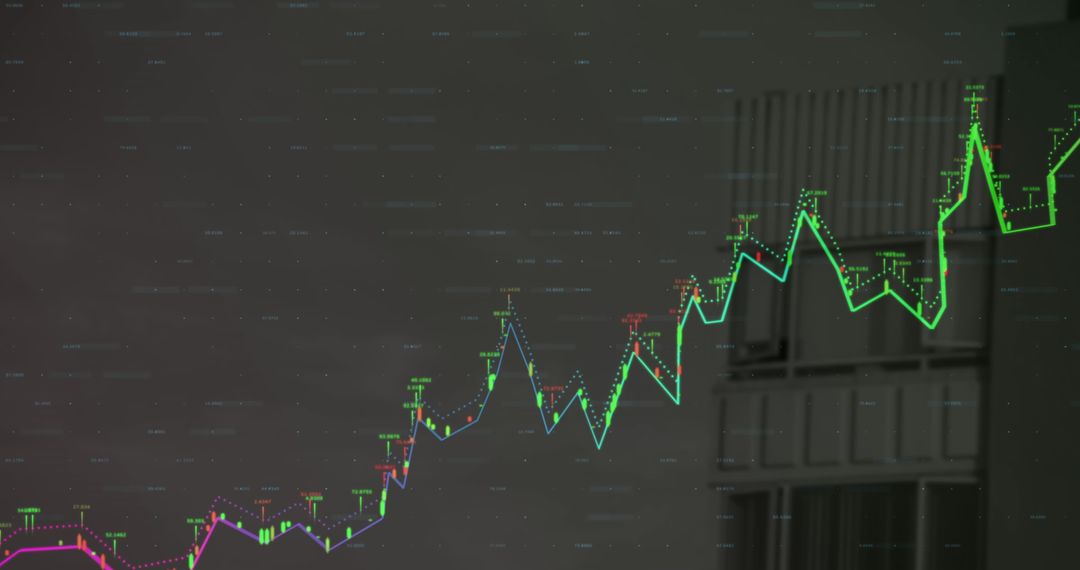
- Rising Green Market Graph Overlay in Dimly Lit Cityscape
Rising Green Market Graph Overlay in Dimly Lit Cityscape Image

Green market graph showing an upward trend superimposed on a blurred cityscape background. Symbolizes financial growth and positive economic outlook. Useful for financial and investment presentations, analyses of market trends, or articles focused on economic data interpretation.
Powered by 


2
downloads
downloads
Tags:
More
Credit Photo
If you would like to credit the Photo, here are some ways you can do so
Text Link
photo Link
<span class="text-link">
<span>
<a target="_blank" href=https://pikwizard.com/photo/rising-green-market-graph-overlay-in-dimly-lit-cityscape/518ddfb7b51dbd2fb7b446763d54f918/>PikWizard</a>
</span>
</span>
<span class="image-link">
<span
style="margin: 0 0 20px 0; display: inline-block; vertical-align: middle; width: 100%;"
>
<a
target="_blank"
href="https://pikwizard.com/photo/rising-green-market-graph-overlay-in-dimly-lit-cityscape/518ddfb7b51dbd2fb7b446763d54f918/"
style="text-decoration: none; font-size: 10px; margin: 0;"
>
<img src="https://pikwizard.com/pw/medium/518ddfb7b51dbd2fb7b446763d54f918.jpg" style="margin: 0; width: 100%;" alt="" />
<p style="font-size: 12px; margin: 0;">PikWizard</p>
</a>
</span>
</span>
Free (free of charge)
Free for personal and commercial use.
Author: Authentic Images
Similar Free Stock Images

Premium


Premium


Premium


Premium


Premium


Premium


Premium


Premium


Premium


Premium


Premium


Premium


Premium


Premium


Premium


Premium


Premium


Premium


Premium


Premium


Premium


Premium


Premium


Premium