- Home >
- Stock Photos >
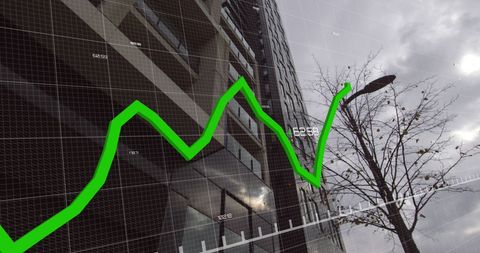
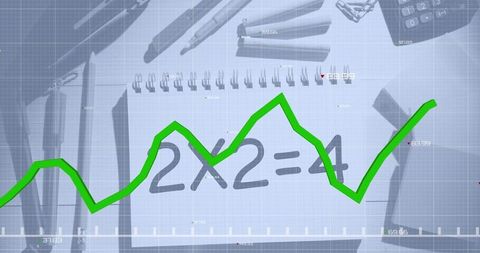
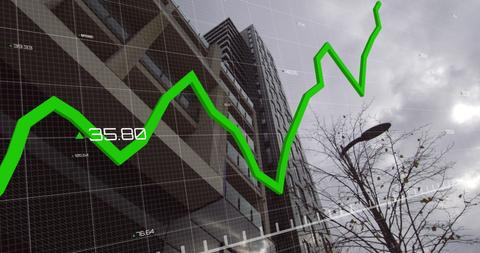
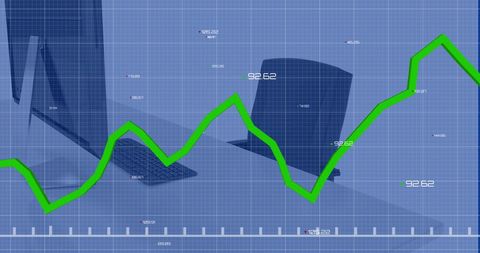
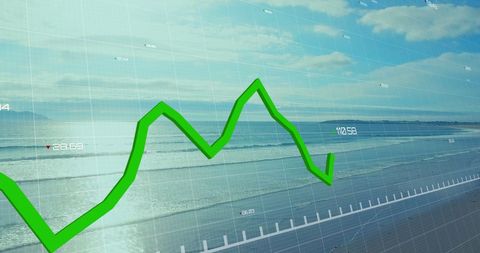
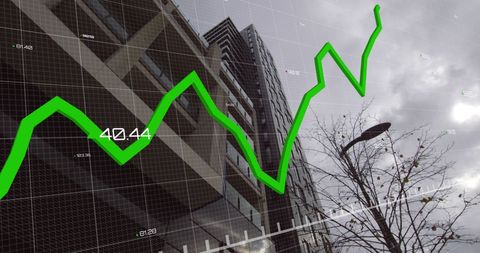
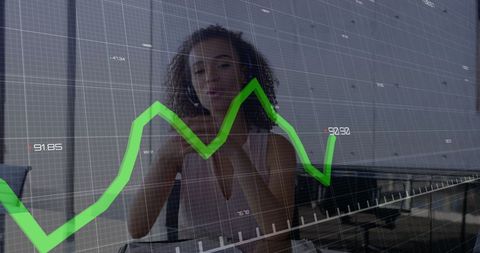
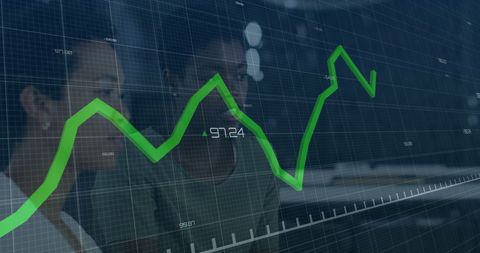
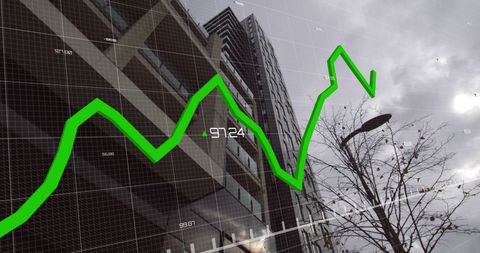
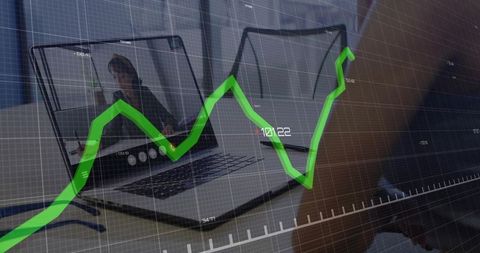
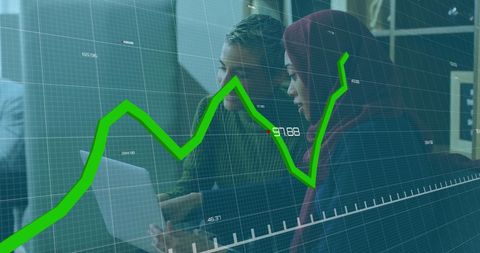
- Rising Line Graph and Digital Data on Modern Interface
Rising Line Graph and Digital Data on Modern Interface Image

Rising green line graph overlaid with numerical data displayed on translucent digital screens and grids, evokes the atmosphere of advanced data processing in the context of finance and global business analytics. Useful for illustrating economic growth, data-driven decision making, and trends in digital technologies. May be used in contexts such as financial reports, global market analysis presentations, and technology-tech advertising.

downloads
Tags:
More
Credit Photo
If you would like to credit the Photo, here are some ways you can do so
Text Link
photo Link
<span class="text-link">
<span>
<a target="_blank" href=https://pikwizard.com/photo/rising-line-graph-and-digital-data-on-modern-interface/ac5d0a68a8a366346e30555b96f18afc/>PikWizard</a>
</span>
</span>
<span class="image-link">
<span
style="margin: 0 0 20px 0; display: inline-block; vertical-align: middle; width: 100%;"
>
<a
target="_blank"
href="https://pikwizard.com/photo/rising-line-graph-and-digital-data-on-modern-interface/ac5d0a68a8a366346e30555b96f18afc/"
style="text-decoration: none; font-size: 10px; margin: 0;"
>
<img src="https://pikwizard.com/pw/medium/ac5d0a68a8a366346e30555b96f18afc.jpg" style="margin: 0; width: 100%;" alt="" />
<p style="font-size: 12px; margin: 0;">PikWizard</p>
</a>
</span>
</span>
Free (free of charge)
Free for personal and commercial use.
Author: People Creations