- Home >
- Stock Photos >
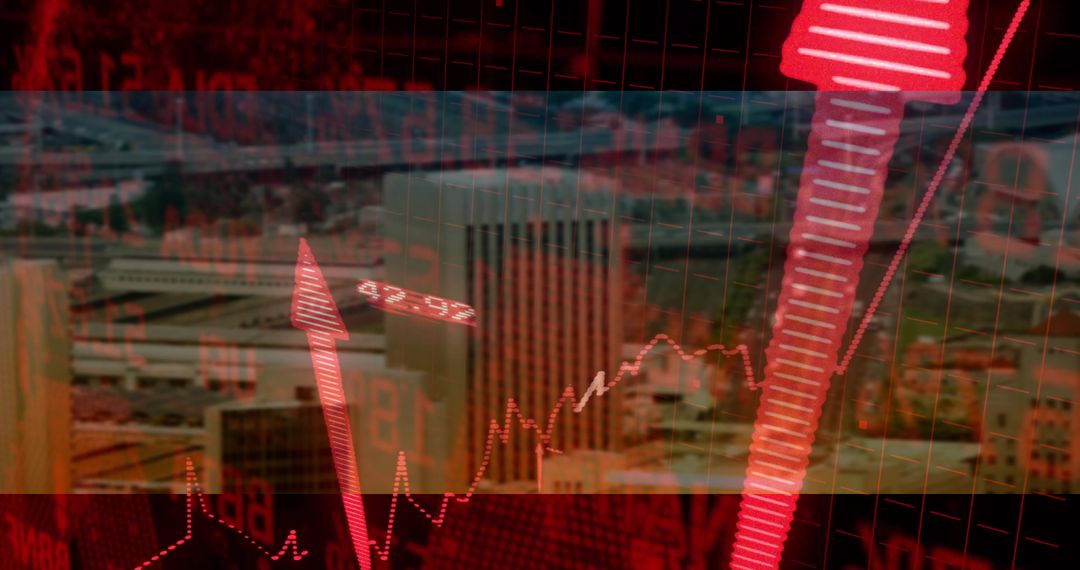
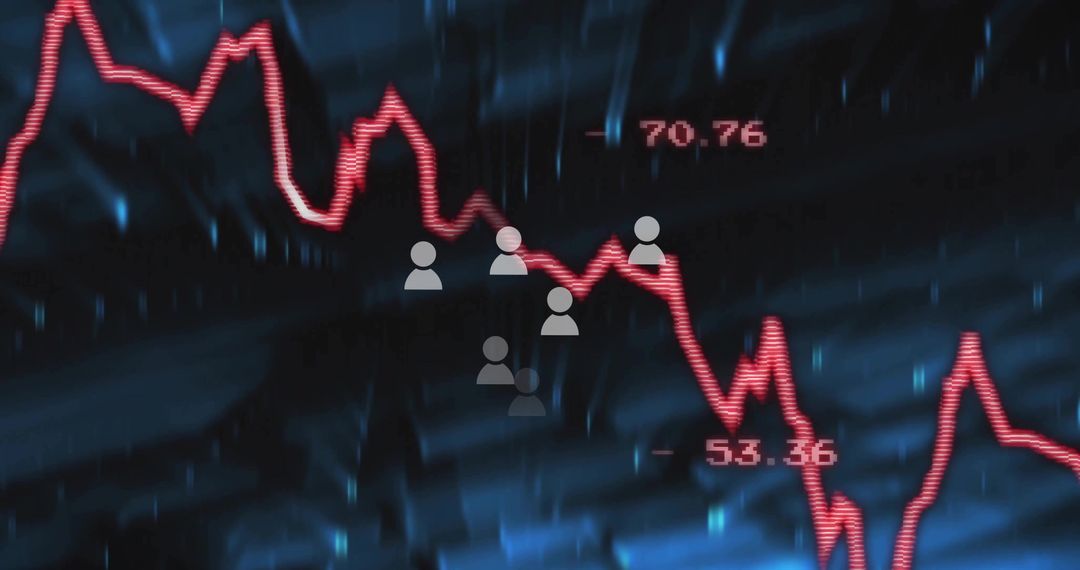
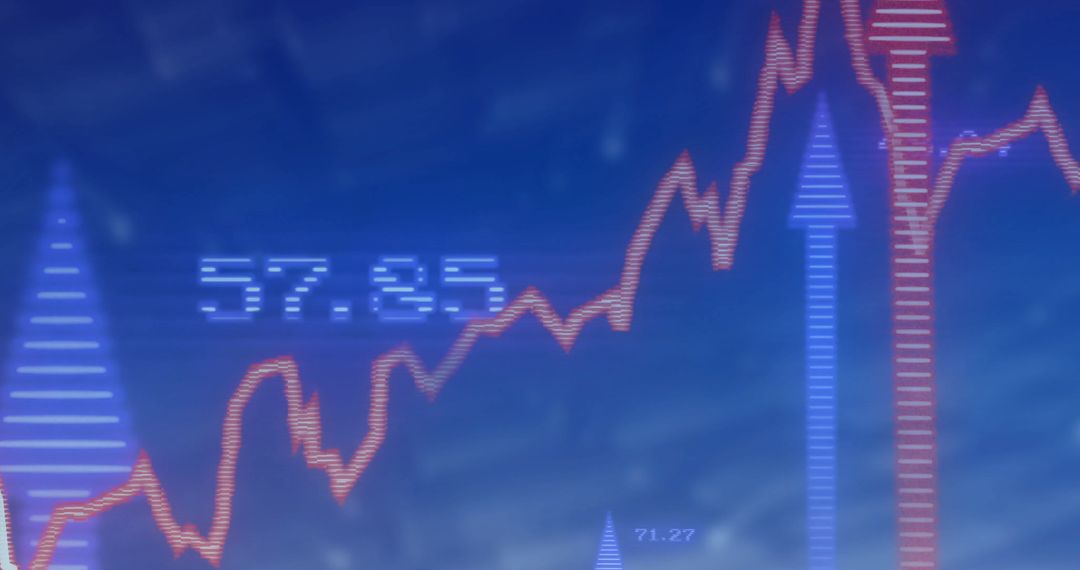
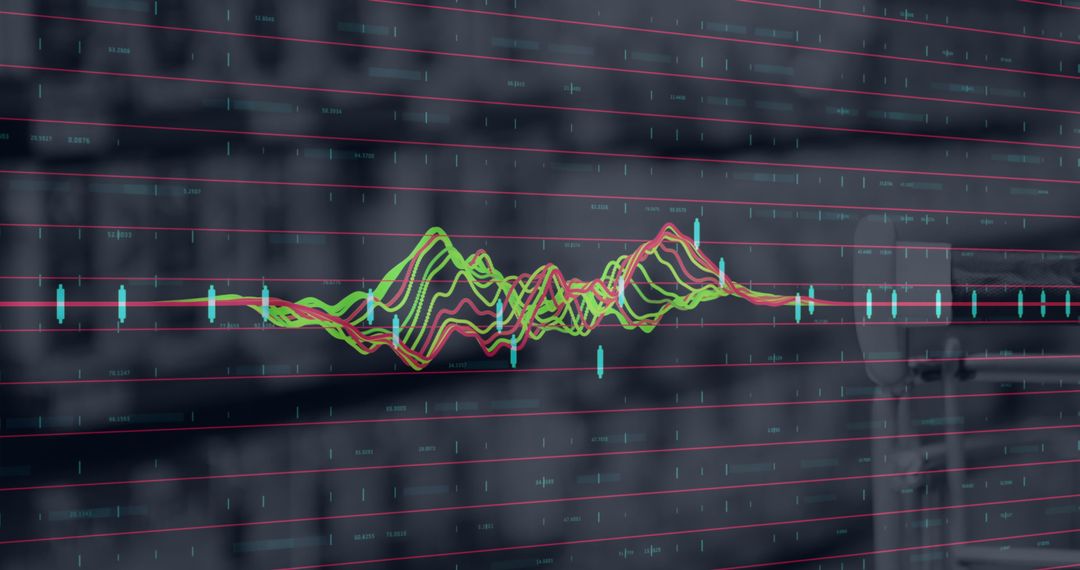
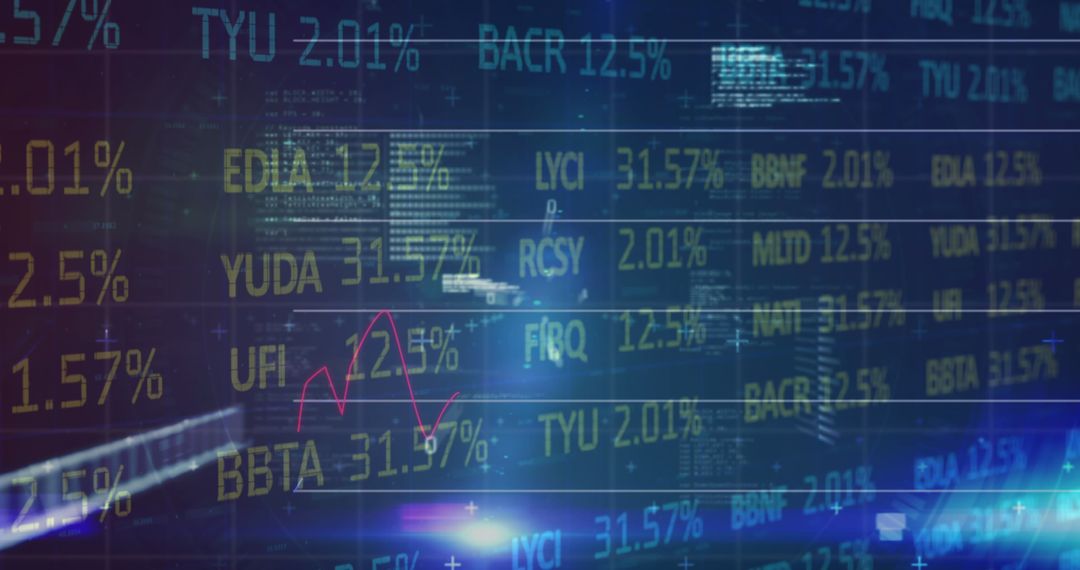
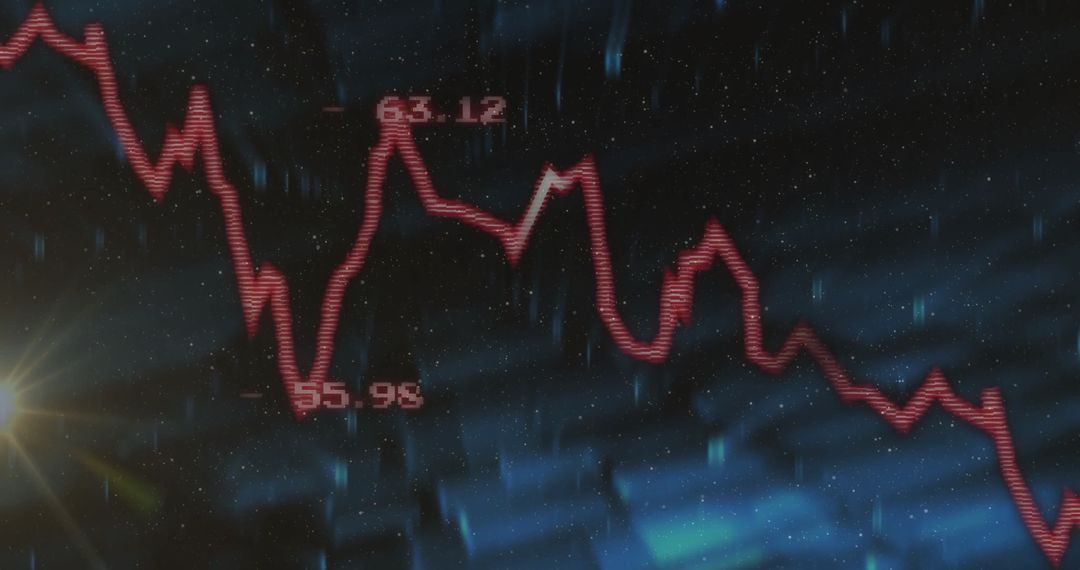
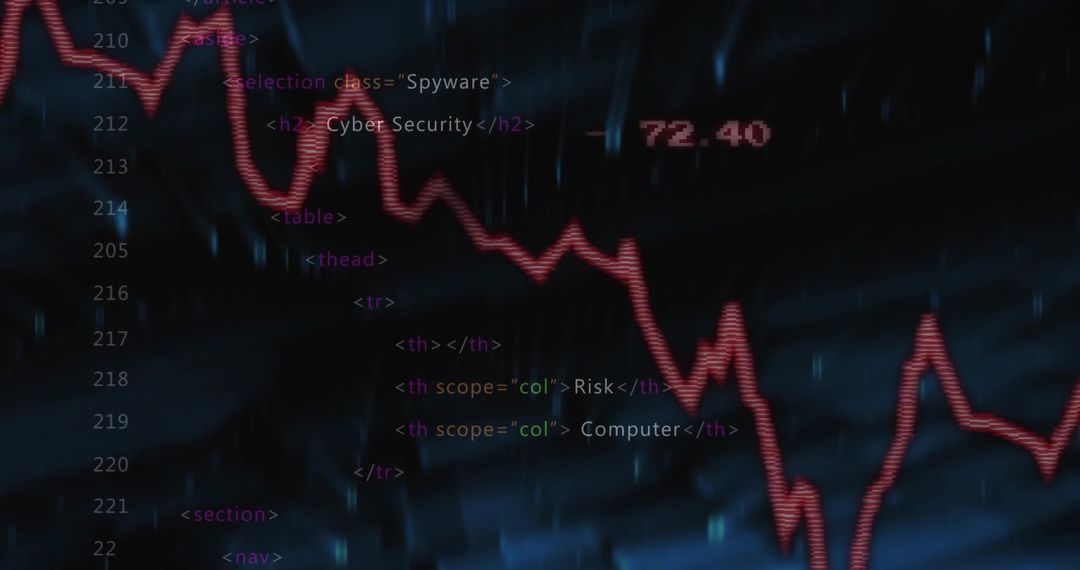
- Rising Market Trends Depicted in Red Digital Graph Interface
Rising Market Trends Depicted in Red Digital Graph Interface Image

Illustrates fluctuating market trends with red directional indicators, useful for finance, investment analysis, presentations on stock performance or economic forecasts.
Powered by 


0
downloads
downloads
Tags:
More
Credit Photo
If you would like to credit the Photo, here are some ways you can do so
Text Link
photo Link
<span class="text-link">
<span>
<a target="_blank" href=https://pikwizard.com/photo/rising-market-trends-depicted-in-red-digital-graph-interface/9ef6298c2c8c0eb28a235001b3f4cc13/>PikWizard</a>
</span>
</span>
<span class="image-link">
<span
style="margin: 0 0 20px 0; display: inline-block; vertical-align: middle; width: 100%;"
>
<a
target="_blank"
href="https://pikwizard.com/photo/rising-market-trends-depicted-in-red-digital-graph-interface/9ef6298c2c8c0eb28a235001b3f4cc13/"
style="text-decoration: none; font-size: 10px; margin: 0;"
>
<img src="https://pikwizard.com/pw/medium/9ef6298c2c8c0eb28a235001b3f4cc13.jpg" style="margin: 0; width: 100%;" alt="" />
<p style="font-size: 12px; margin: 0;">PikWizard</p>
</a>
</span>
</span>
Free (free of charge)
Free for personal and commercial use.
Author: Authentic Images
Similar Free Stock Images

Premium


Premium


Premium


Premium


Premium


Premium


Premium


Premium


Premium


Premium


Premium


Premium


Premium


Premium


Premium


Premium


Premium


Premium


Premium


Premium


Premium


Premium


Premium


Premium