- Home >
- Stock Photos >
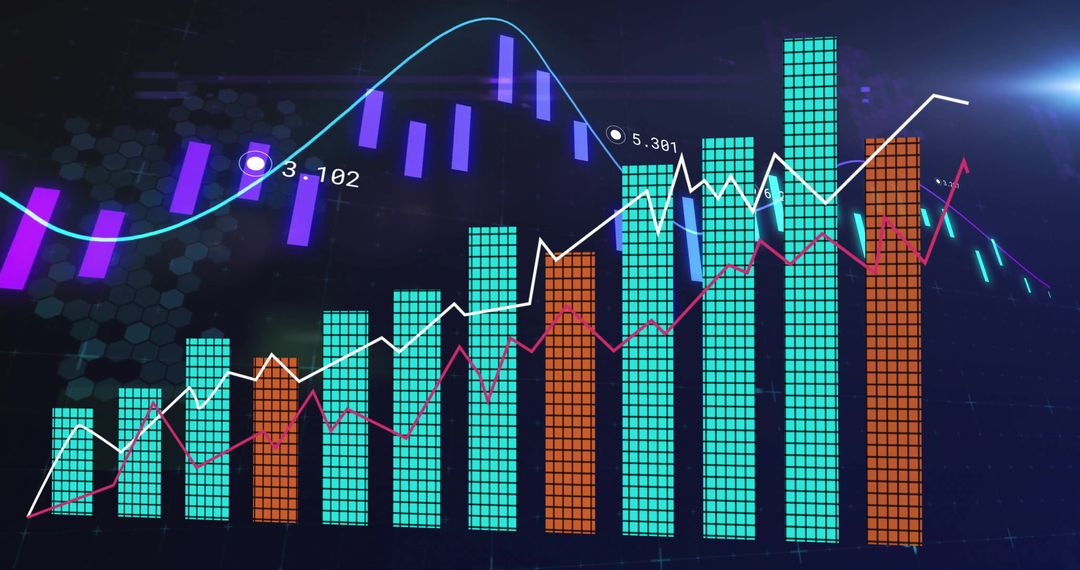
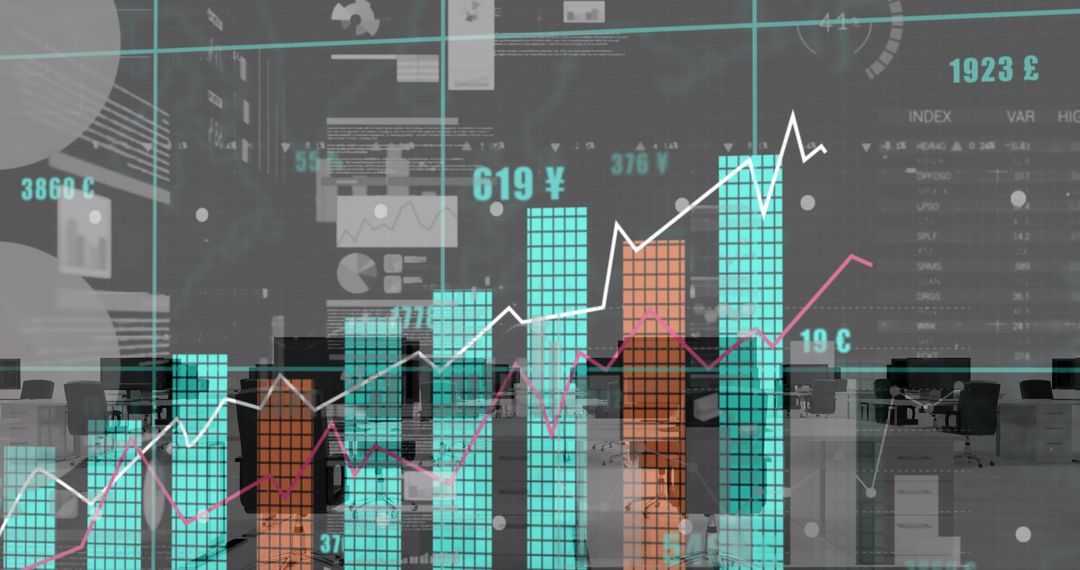
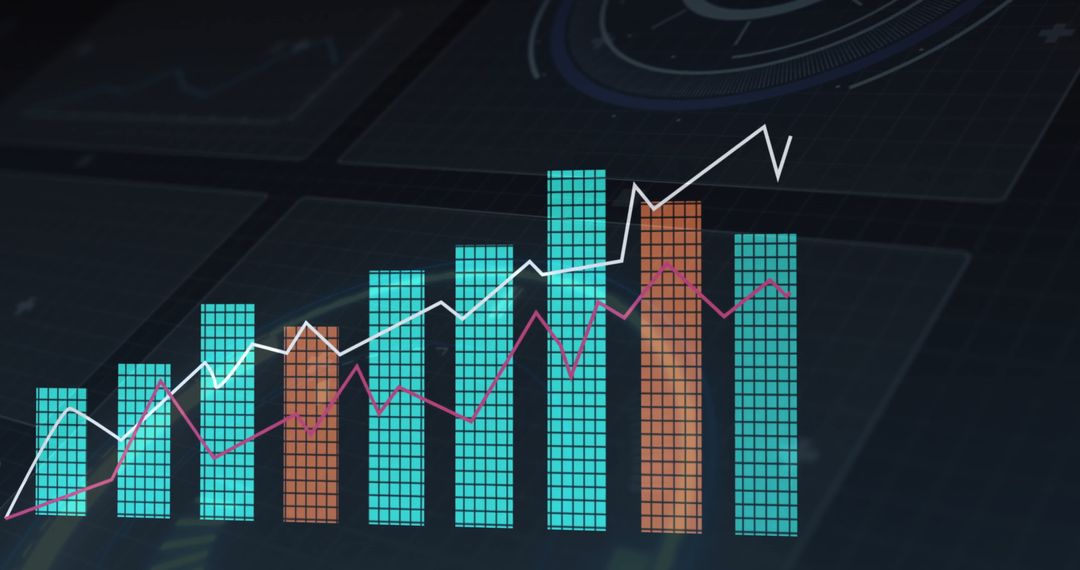
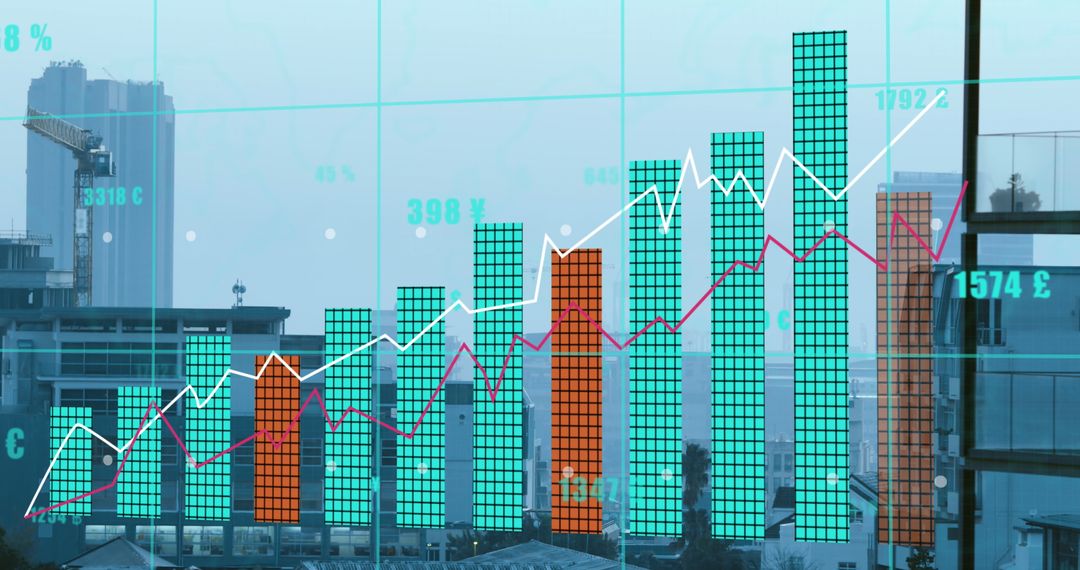
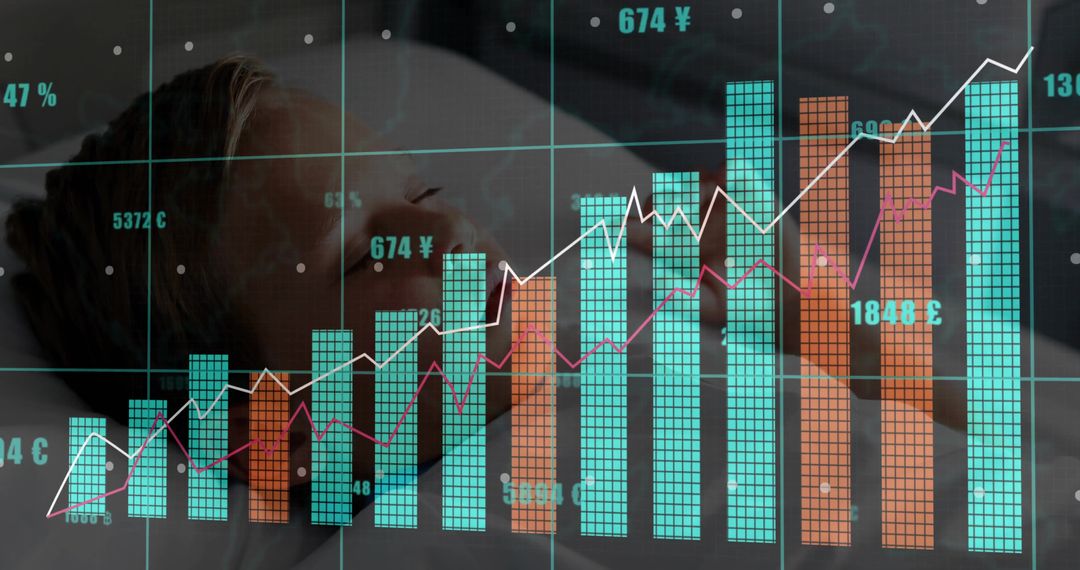
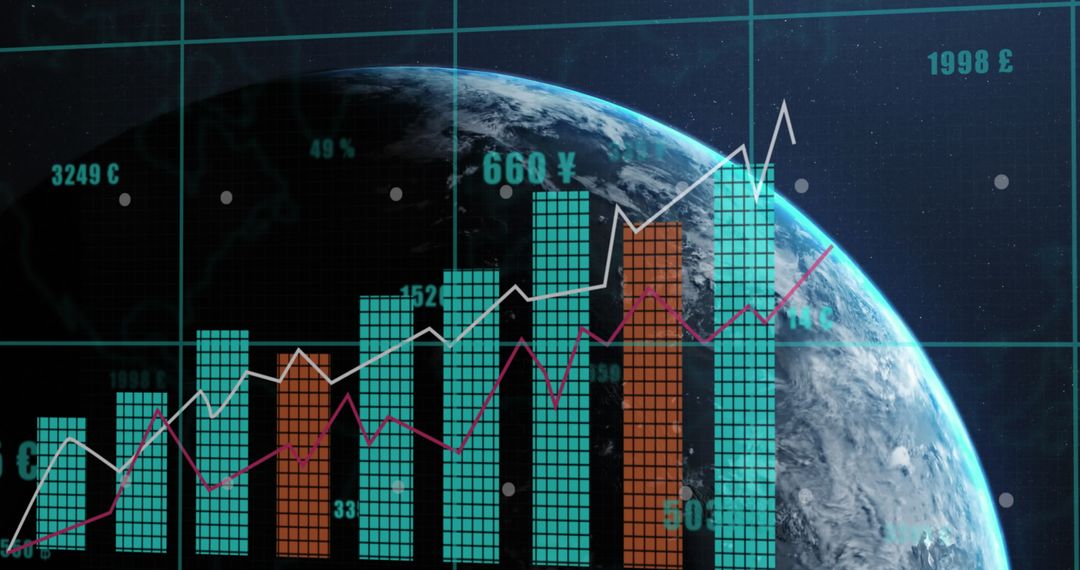
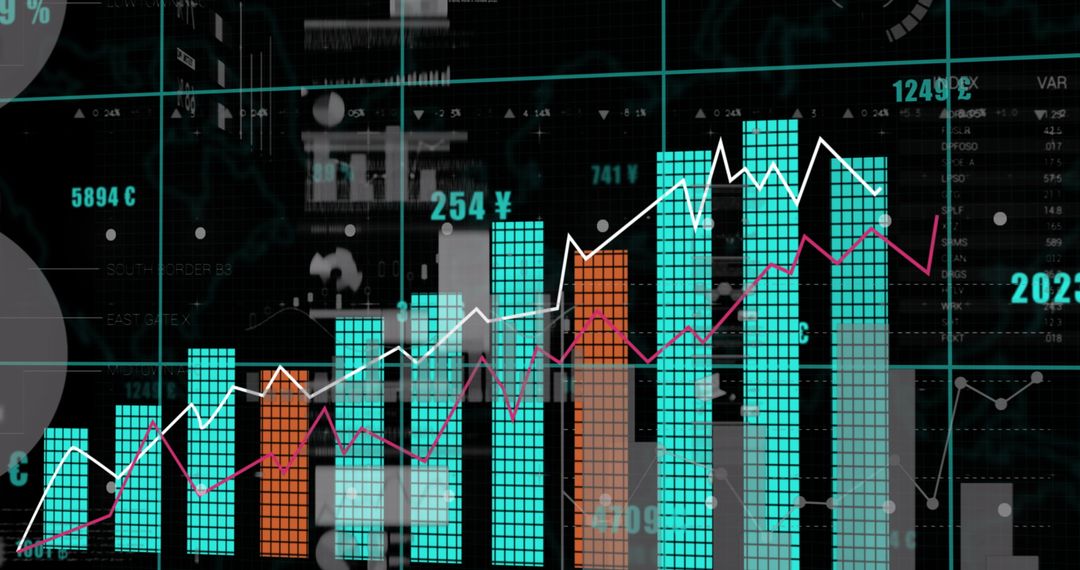
- Rising Multi-Series Financial Bar Chart Showing Trend Lines on Glass Dashboard
Rising Multi-Series Financial Bar Chart Showing Trend Lines on Glass Dashboard Image
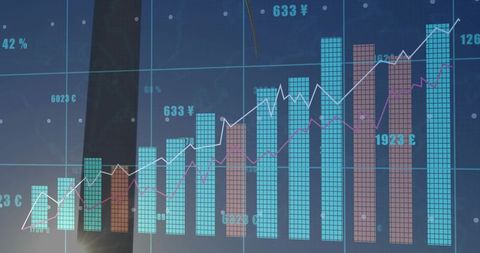
Showing multi-series bar chart with two overlaid trend lines, grid overlay, and currency markers on glass display. Ideal for finance presentations, market analysis reports, investor pitch decks, and business intelligence dashboards. Working well as hero banner for fintech websites, blog articles about market trends, or slides about revenue forecasting and performance review. Featuring turquoise palette and glossy reflection for modern corporate and tech-focused visual style.
Powered by 


0
downloads
downloads
Tags:
More
Credit Photo
If you would like to credit the Photo, here are some ways you can do so
Text Link
photo Link
<span class="text-link">
<span>
<a target="_blank" href=https://pikwizard.com/photo/rising-multi-series-financial-bar-chart-showing-trend-lines-on-glass-dashboard/457ababd79d66e99603f29d33d5b3bdc/>PikWizard</a>
</span>
</span>
<span class="image-link">
<span
style="margin: 0 0 20px 0; display: inline-block; vertical-align: middle; width: 100%;"
>
<a
target="_blank"
href="https://pikwizard.com/photo/rising-multi-series-financial-bar-chart-showing-trend-lines-on-glass-dashboard/457ababd79d66e99603f29d33d5b3bdc/"
style="text-decoration: none; font-size: 10px; margin: 0;"
>
<img src="https://pikwizard.com/pw/medium/457ababd79d66e99603f29d33d5b3bdc.jpg" style="margin: 0; width: 100%;" alt="" />
<p style="font-size: 12px; margin: 0;">PikWizard</p>
</a>
</span>
</span>
Free (free of charge)
Free for personal and commercial use.
Author: People Creations
Similar Free Stock Images
Premium


Premium


Premium


Premium


Premium


Premium


Premium


Premium


Premium


Premium


Premium


Premium


Premium


Premium


Premium


Premium


Premium


Premium


Premium


Premium


Premium


Premium


Premium


Premium