- Home >
- Stock Photos >
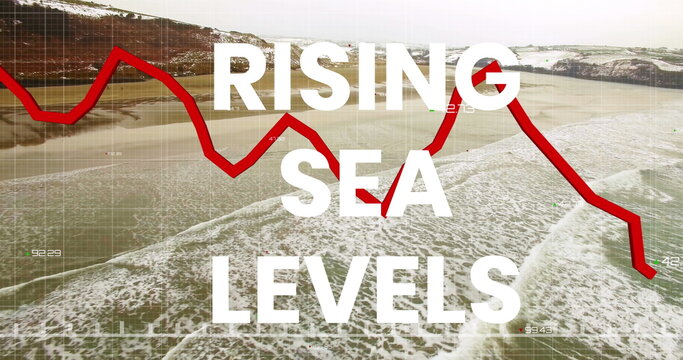
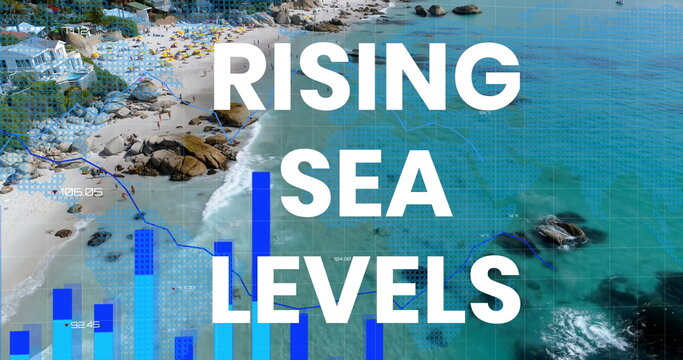
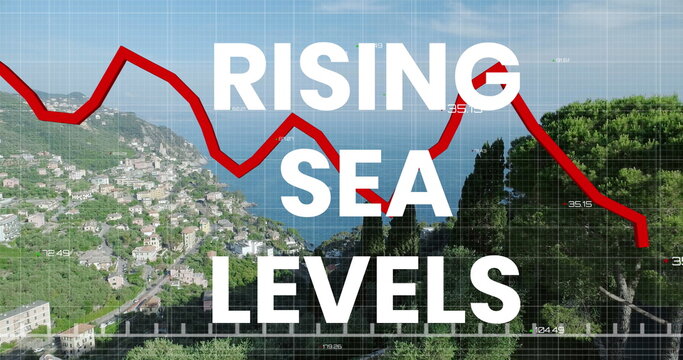
- Rising Sea Levels on Financial Graph Highlighting Climate Impact
Rising Sea Levels on Financial Graph Highlighting Climate Impact Image

Visualization depicting effects of rising sea levels intersecting with a financial graph. Ideal for illustrating discussions around the intersection of environmental and economic challenges. Useful for presentations, educational materials, and articles focusing on climate change and economic strategies.
Powered by 


2
downloads
downloads
Tags:
More
Credit Photo
If you would like to credit the Photo, here are some ways you can do so
Text Link
photo Link
<span class="text-link">
<span>
<a target="_blank" href=https://pikwizard.com/photo/rising-sea-levels-on-financial-graph-highlighting-climate-impact/3cdebb18d7dc71bf0236512ce3b58d8f/>PikWizard</a>
</span>
</span>
<span class="image-link">
<span
style="margin: 0 0 20px 0; display: inline-block; vertical-align: middle; width: 100%;"
>
<a
target="_blank"
href="https://pikwizard.com/photo/rising-sea-levels-on-financial-graph-highlighting-climate-impact/3cdebb18d7dc71bf0236512ce3b58d8f/"
style="text-decoration: none; font-size: 10px; margin: 0;"
>
<img src="https://pikwizard.com/pw/medium/3cdebb18d7dc71bf0236512ce3b58d8f.jpg" style="margin: 0; width: 100%;" alt="" />
<p style="font-size: 12px; margin: 0;">PikWizard</p>
</a>
</span>
</span>
Free (free of charge)
Free for personal and commercial use.
Author: Creative Art
Similar Free Stock Images

Premium


Premium