- Home >
- Stock Photos >
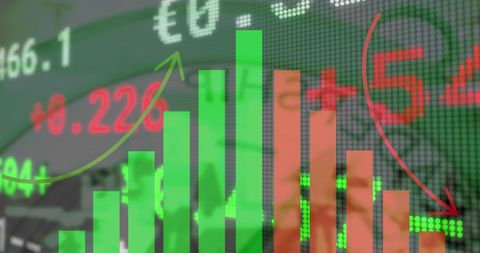
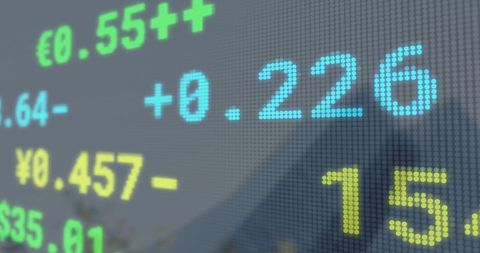
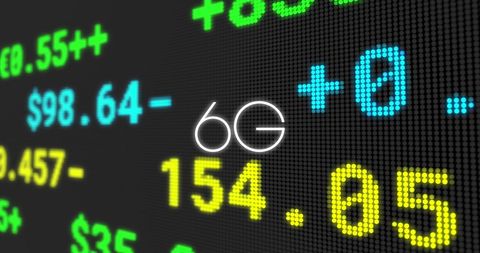
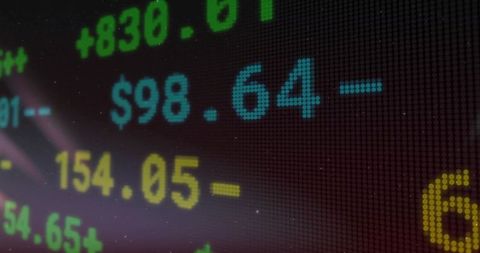
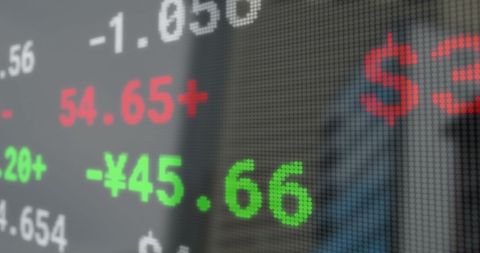
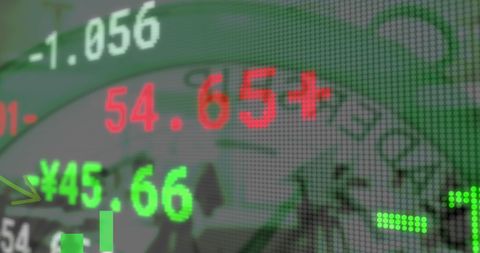
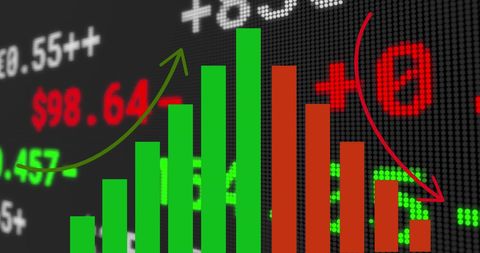
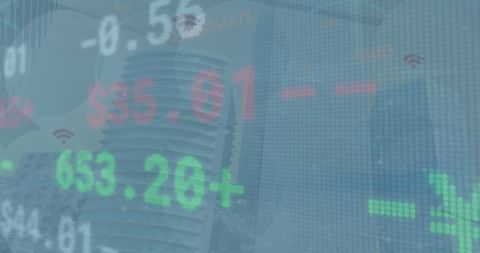
- Rising Stock Market Graph on Digital Interface
Rising Stock Market Graph on Digital Interface Image

Depicts a green bar graph superimposed on digital display, indicating financial growth and stock market trends. Useful for finance blogs, investment news articles, or business presentations illustrating positive market outlooks and data analysis strategies.

downloads
Tags:
More
Credit Photo
If you would like to credit the Photo, here are some ways you can do so
Text Link
photo Link
<span class="text-link">
<span>
<a target="_blank" href=https://pikwizard.com/photo/rising-stock-market-graph-on-digital-interface/33bef2f513e26fe9b5099fef347cdcb6/>PikWizard</a>
</span>
</span>
<span class="image-link">
<span
style="margin: 0 0 20px 0; display: inline-block; vertical-align: middle; width: 100%;"
>
<a
target="_blank"
href="https://pikwizard.com/photo/rising-stock-market-graph-on-digital-interface/33bef2f513e26fe9b5099fef347cdcb6/"
style="text-decoration: none; font-size: 10px; margin: 0;"
>
<img src="https://pikwizard.com/pw/medium/33bef2f513e26fe9b5099fef347cdcb6.jpg" style="margin: 0; width: 100%;" alt="" />
<p style="font-size: 12px; margin: 0;">PikWizard</p>
</a>
</span>
</span>
Free (free of charge)
Free for personal and commercial use.
Author: Creative Art