- Home >
- Stock Photos >
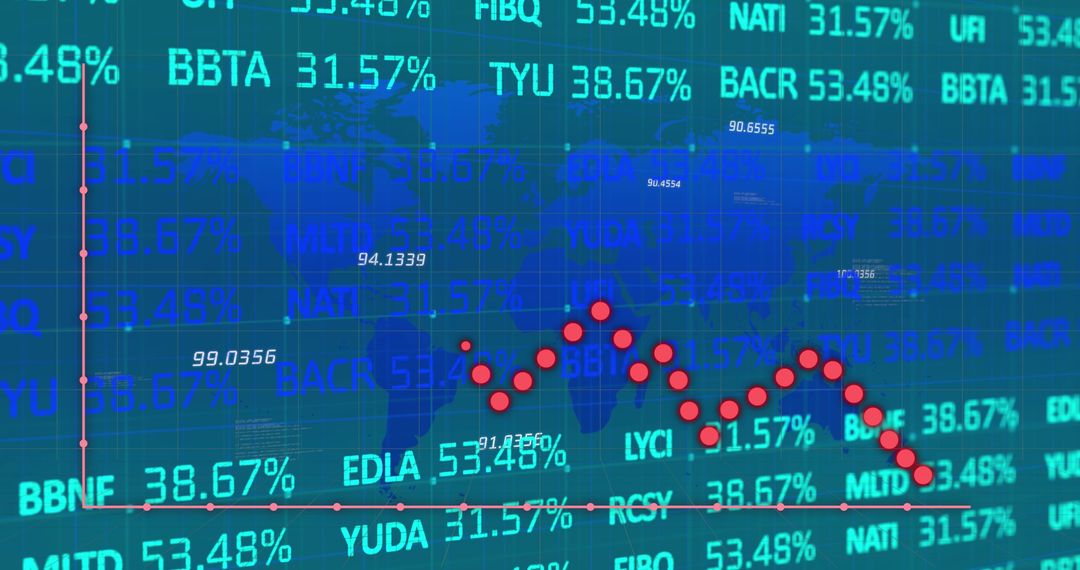
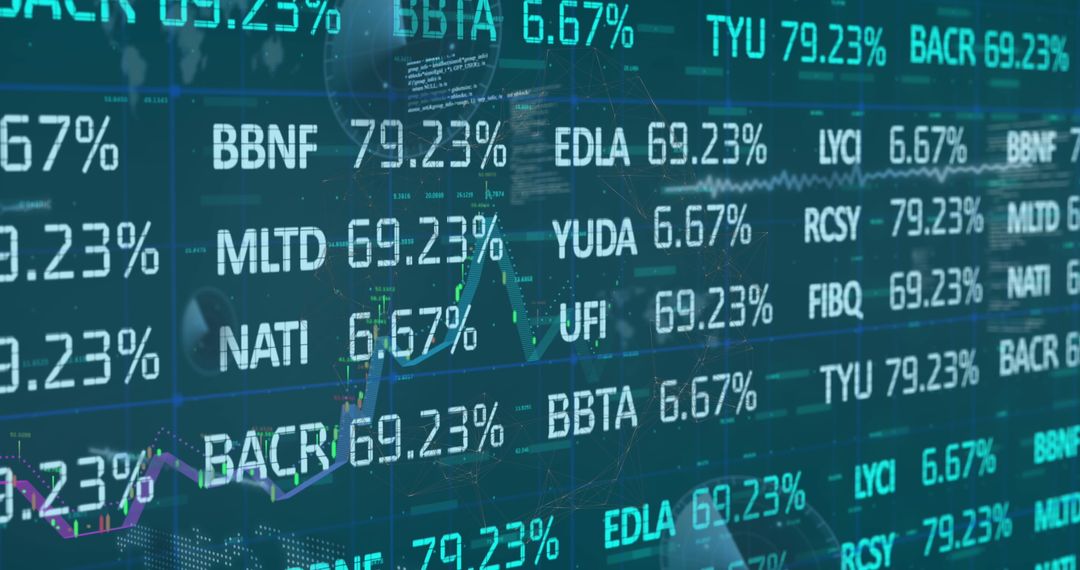
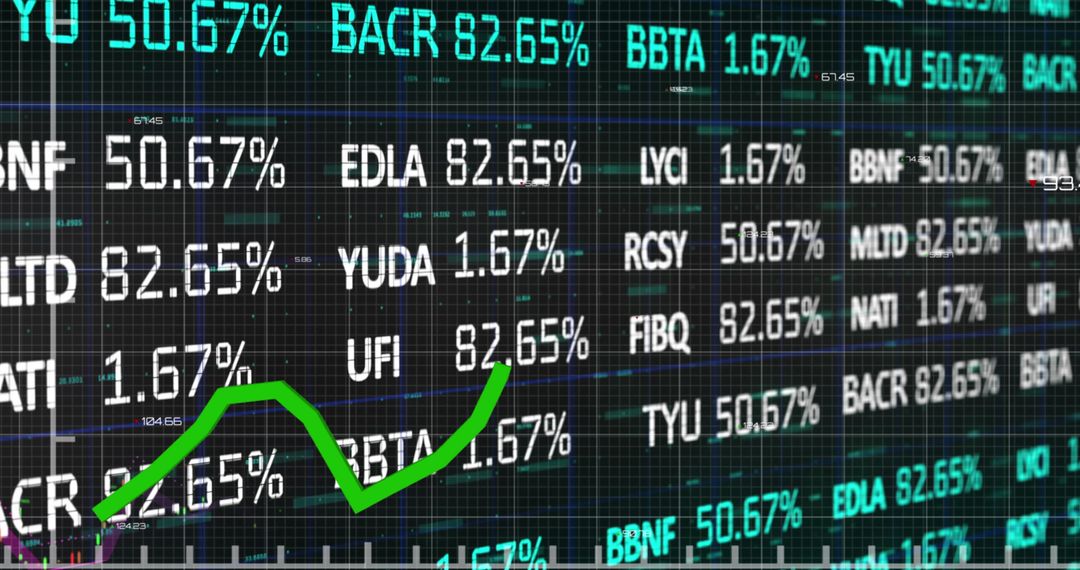
- Rising Stock Market Graph with Global Data Interface
Rising Stock Market Graph with Global Data Interface Image

Features dynamic rising graph overlaid on digital blue world map background, symbolizing rising stock prices and investment growth. Useful for illustrating global financial trends, investment opportunities, technological advancements in finance. Ideal for articles on economic growth, finance blogs, stock market analysis, global business relations.
Powered by 


2
downloads
downloads
Tags:
More
Credit Photo
If you would like to credit the Photo, here are some ways you can do so
Text Link
photo Link
<span class="text-link">
<span>
<a target="_blank" href=https://pikwizard.com/photo/rising-stock-market-graph-with-global-data-interface/5bec0a24f5de726954331e0effec529b/>PikWizard</a>
</span>
</span>
<span class="image-link">
<span
style="margin: 0 0 20px 0; display: inline-block; vertical-align: middle; width: 100%;"
>
<a
target="_blank"
href="https://pikwizard.com/photo/rising-stock-market-graph-with-global-data-interface/5bec0a24f5de726954331e0effec529b/"
style="text-decoration: none; font-size: 10px; margin: 0;"
>
<img src="https://pikwizard.com/pw/medium/5bec0a24f5de726954331e0effec529b.jpg" style="margin: 0; width: 100%;" alt="" />
<p style="font-size: 12px; margin: 0;">PikWizard</p>
</a>
</span>
</span>
Free (free of charge)
Free for personal and commercial use.
Author: Creative Art
Similar Free Stock Images
Premium


Premium


Premium


Premium


Premium


Premium


Premium


Premium


Premium


Premium


Premium


Premium


Premium


Premium


Premium


Premium


Premium


Premium


Premium


Premium


Premium


Premium


Premium


Premium