- Home >
- Stock Photos >
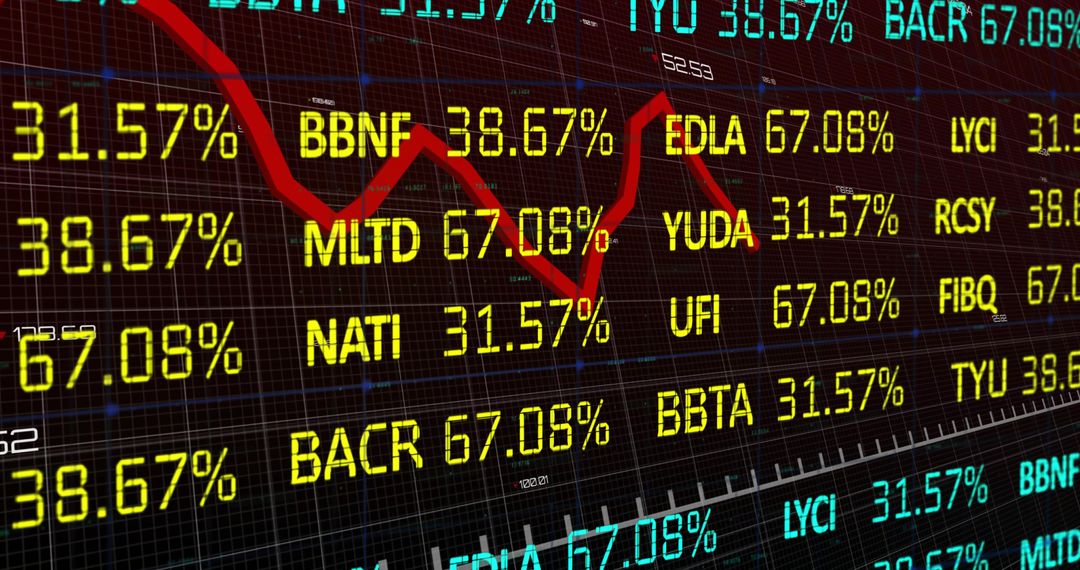
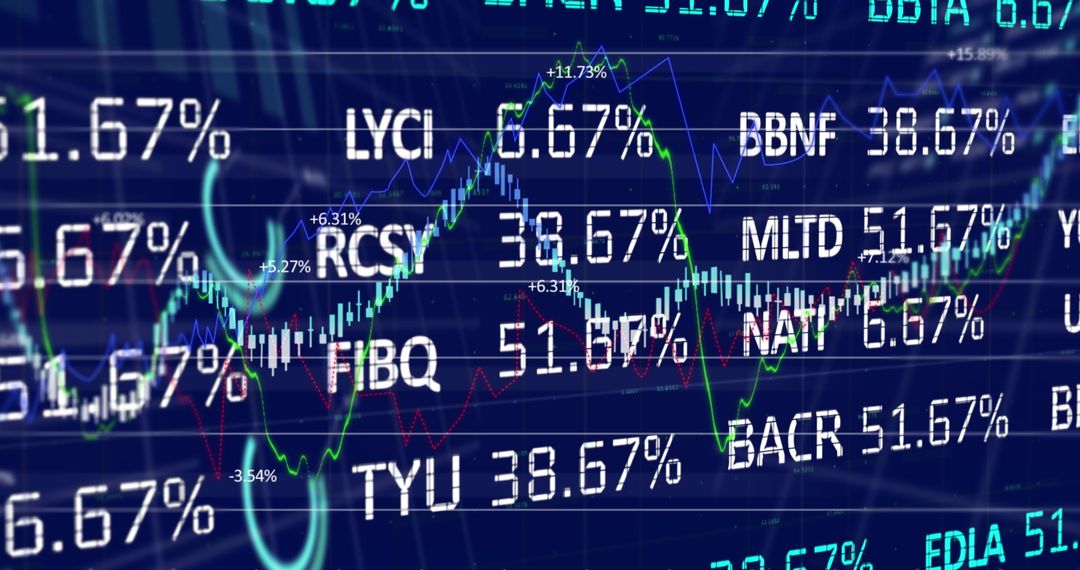
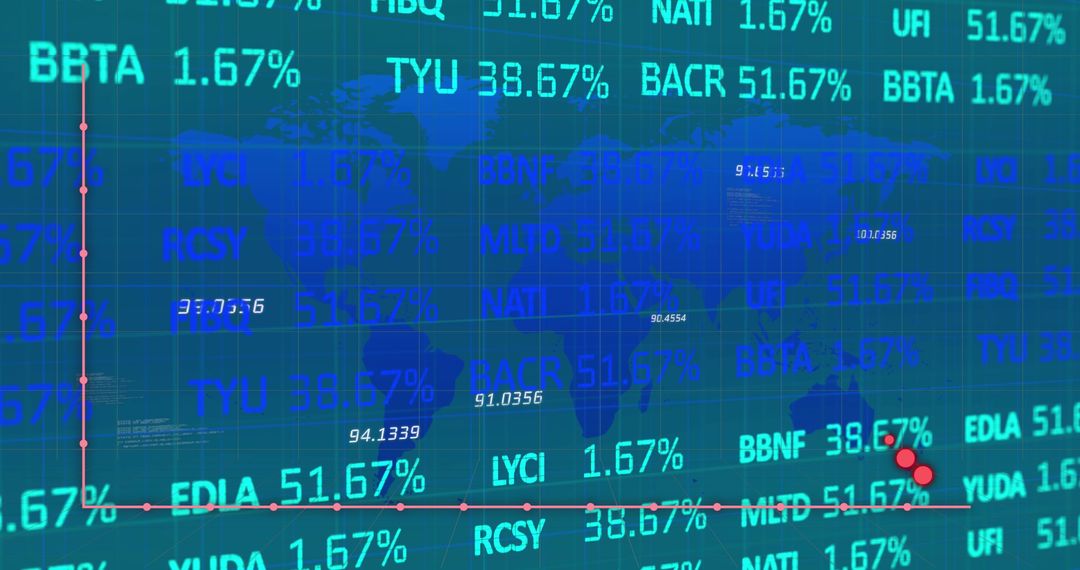
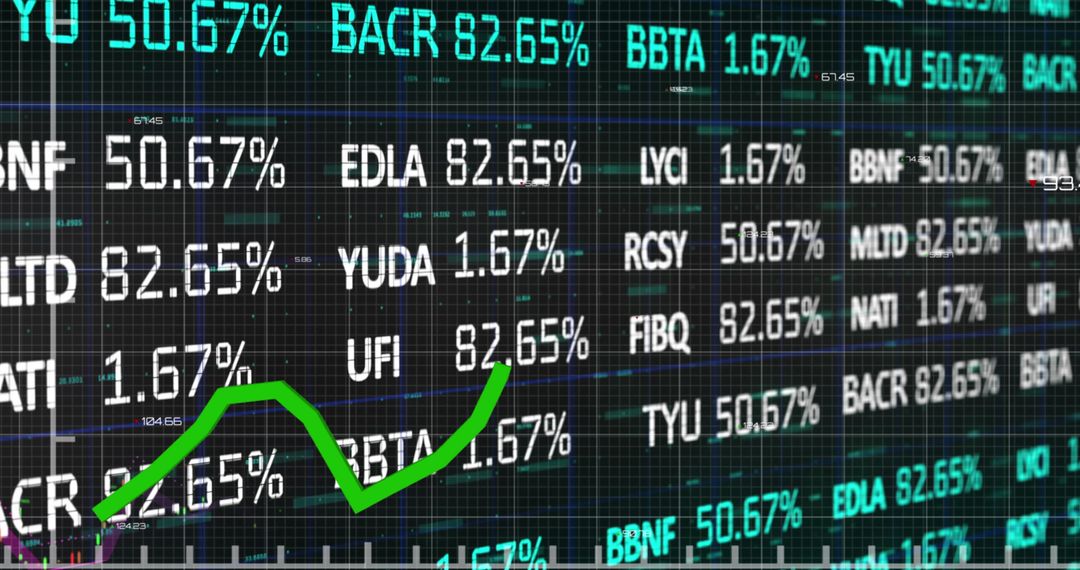
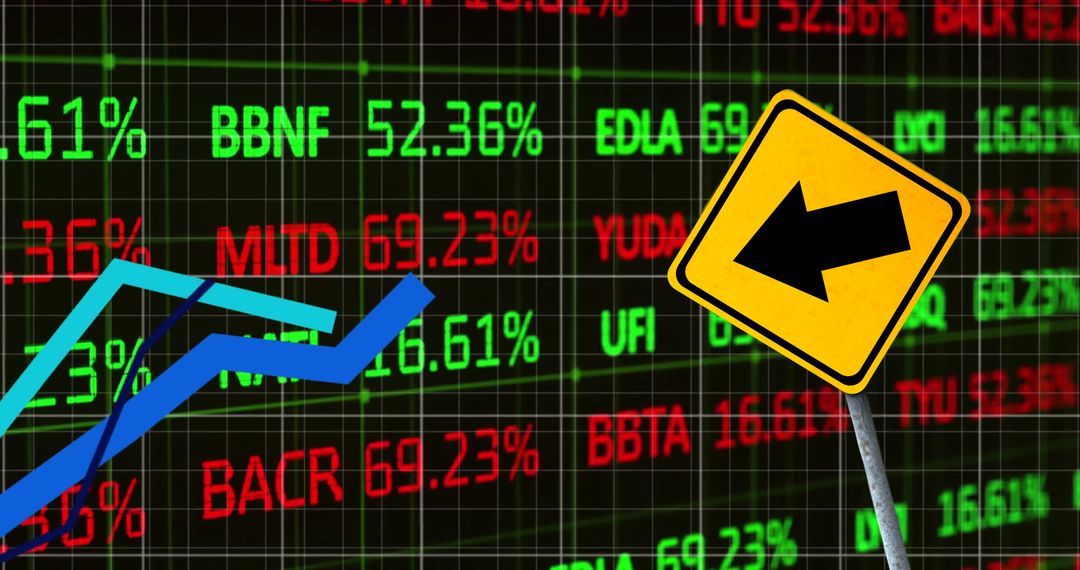
- Rising Stock Market Trends with Data Visualization Graphic
Rising Stock Market Trends with Data Visualization Graphic Image

This dynamic image of stock market trends features overlapping graphs and data visualization in a simulated, complex structure. It depicts increasing market performance through graphical representation, ideal for use in financial reports, investment brochures, trading platforms, and business analytics presentations. Emphasizing growth and financial analysis, it enhances understanding of market trends in an engaging visual form.
Powered by  - Get 15% off with code: PIKWIZARD15


2
downloads
downloads
Tags:
More
Credit Photo
If you would like to credit the Photo, here are some ways you can do so
Text Link
photo Link
<span class="text-link">
<span>
<a target="_blank" href=https://pikwizard.com/photo/rising-stock-market-trends-with-data-visualization-graphic/c9bd0622ab0a713380c6364e22dde28e/>PikWizard</a>
</span>
</span>
<span class="image-link">
<span
style="margin: 0 0 20px 0; display: inline-block; vertical-align: middle; width: 100%;"
>
<a
target="_blank"
href="https://pikwizard.com/photo/rising-stock-market-trends-with-data-visualization-graphic/c9bd0622ab0a713380c6364e22dde28e/"
style="text-decoration: none; font-size: 10px; margin: 0;"
>
<img src="https://pikwizard.com/pw/medium/c9bd0622ab0a713380c6364e22dde28e.jpg" style="margin: 0; width: 100%;" alt="" />
<p style="font-size: 12px; margin: 0;">PikWizard</p>
</a>
</span>
</span>
Free (free of charge)
Free for personal and commercial use.
Author: Awesome Content
Similar Free Stock Images
Premium


Premium


Premium


Premium


Premium


Premium


Premium


Premium


Premium


Premium


Premium


Premium


Premium


Premium


Premium


Premium


Premium


Premium


Premium


Premium


Premium


Premium


Premium


Premium