- Home >
- Stock Photos >
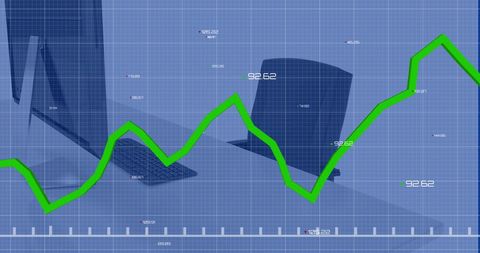
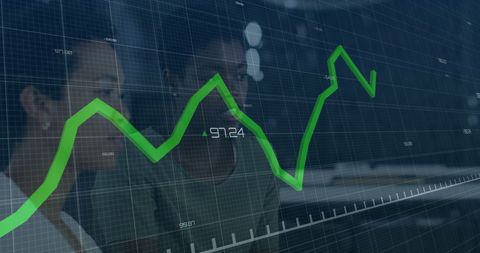
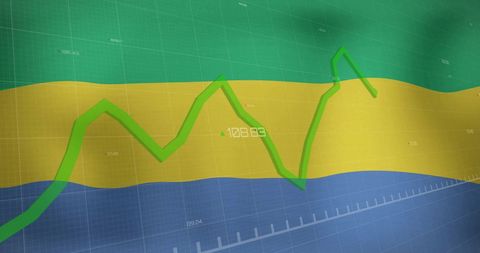
- Rising Trend in Financial Analysis Overlaid on Laptop Silhouette
Rising Trend in Financial Analysis Overlaid on Laptop Silhouette Image

Elevate business presentations and reports with visually engaging stock assets designed to illustrate financial growth and trend analysis. This image captures a dynamic green growth chart spanning over subtle technology elements like the silhouette of a laptop, blending tradition with digital progress. Ideal for conveying concepts in corporate strategy decks, blog posts on the finance industry, or promotional materials highlighting technological advancements in data analysis tools.
Powered by  - Get 15% off with code: PIKWIZARD15


0
downloads
downloads
Tags:
More
Credit Photo
If you would like to credit the Photo, here are some ways you can do so
Text Link
photo Link
<span class="text-link">
<span>
<a target="_blank" href=https://pikwizard.com/photo/rising-trend-in-financial-analysis-overlaid-on-laptop-silhouette/d4568019fca60b45f0660bd0bd1dcee1/>PikWizard</a>
</span>
</span>
<span class="image-link">
<span
style="margin: 0 0 20px 0; display: inline-block; vertical-align: middle; width: 100%;"
>
<a
target="_blank"
href="https://pikwizard.com/photo/rising-trend-in-financial-analysis-overlaid-on-laptop-silhouette/d4568019fca60b45f0660bd0bd1dcee1/"
style="text-decoration: none; font-size: 10px; margin: 0;"
>
<img src="https://pikwizard.com/pw/medium/d4568019fca60b45f0660bd0bd1dcee1.jpg" style="margin: 0; width: 100%;" alt="" />
<p style="font-size: 12px; margin: 0;">PikWizard</p>
</a>
</span>
</span>
Free (free of charge)
Free for personal and commercial use.
Author: Awesome Content
Similar Free Stock Images
Loading...

Premium


Premium


Premium


Premium
Premium


Premium


Premium


Premium


Premium

Premium


Premium

Premium


Premium

Premium

Premium


Premium


Premium

Premium


Premium


Premium

Premium

Premium

Premium

Premium


Premium