- Home >
- Stock Photos >
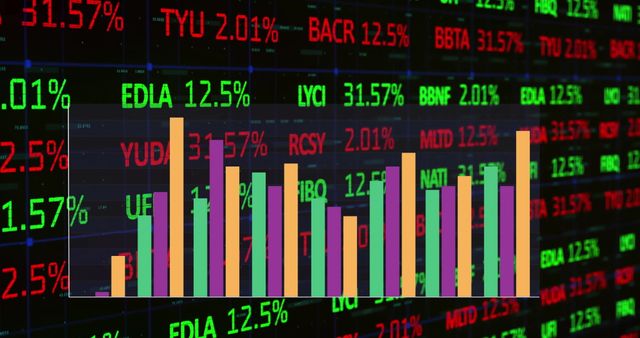
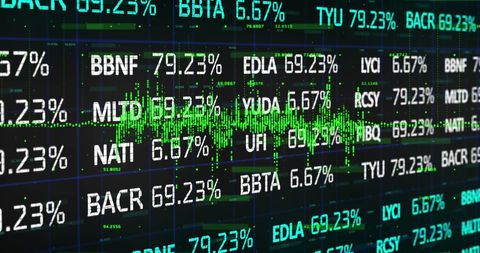
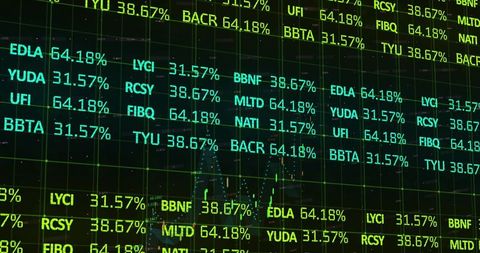
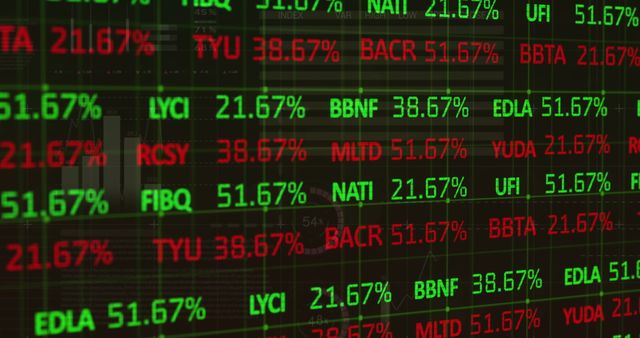
- Rolling Stock Market Data on Digital Interface
Rolling Stock Market Data on Digital Interface Image

Depicts rolling stock market data featuring percentage changes exhibited in red and green. Concepts commonly found in fields related to finance or investment. Useful for illustrating complex market transitions in financial reports, economic news articles, or educational content detailing stock market trends and implications.

downloads
Tags:
More
Credit Photo
If you would like to credit the Photo, here are some ways you can do so
Text Link
photo Link
<span class="text-link">
<span>
<a target="_blank" href=https://pikwizard.com/photo/rolling-stock-market-data-on-digital-interface/5869148eef815f8f9a9fdcc8ee1a0fb4/>PikWizard</a>
</span>
</span>
<span class="image-link">
<span
style="margin: 0 0 20px 0; display: inline-block; vertical-align: middle; width: 100%;"
>
<a
target="_blank"
href="https://pikwizard.com/photo/rolling-stock-market-data-on-digital-interface/5869148eef815f8f9a9fdcc8ee1a0fb4/"
style="text-decoration: none; font-size: 10px; margin: 0;"
>
<img src="https://pikwizard.com/pw/medium/5869148eef815f8f9a9fdcc8ee1a0fb4.jpg" style="margin: 0; width: 100%;" alt="" />
<p style="font-size: 12px; margin: 0;">PikWizard</p>
</a>
</span>
</span>
Free (free of charge)
Free for personal and commercial use.
Author: Authentic Images