- Home >
- Stock Photos >
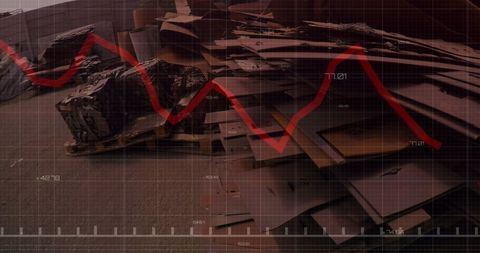
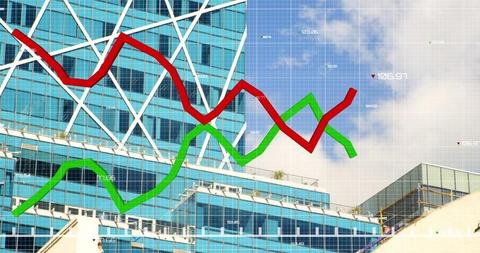
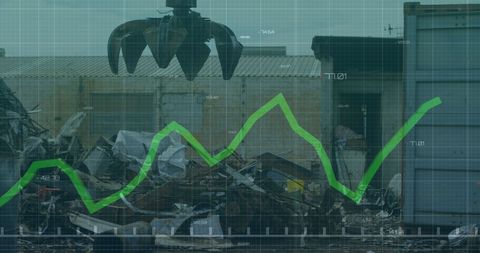
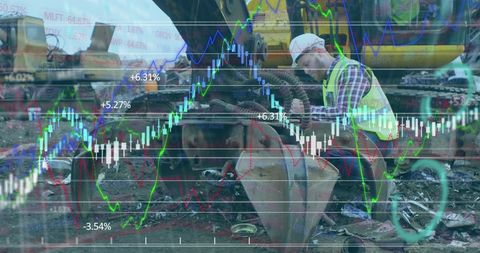
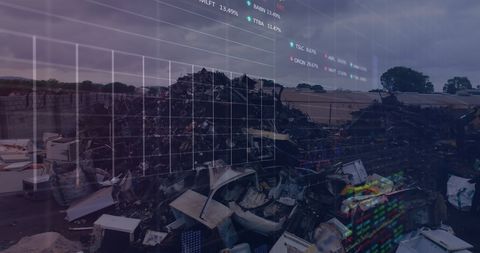
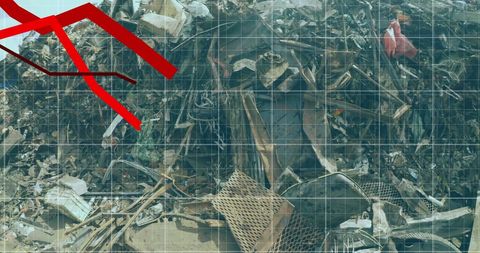
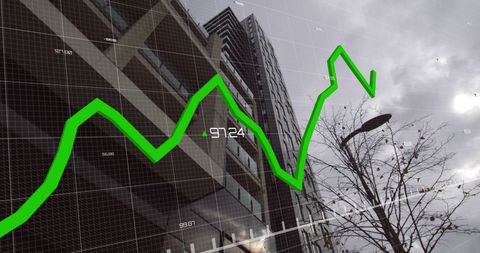
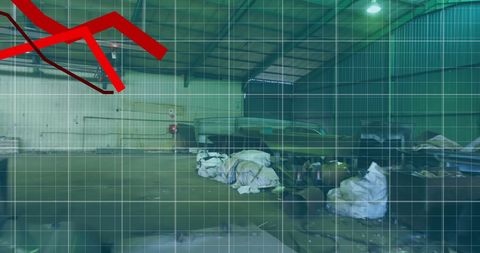
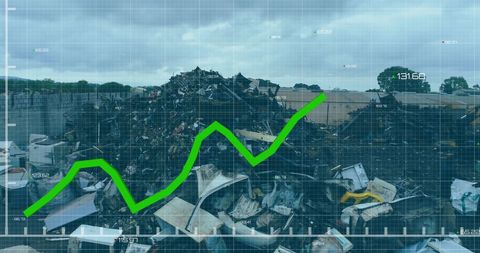
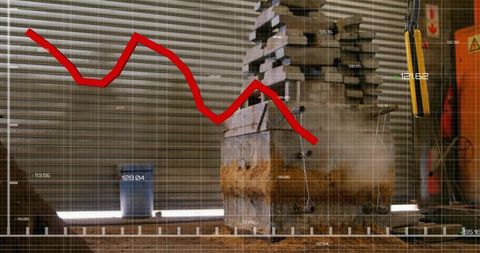
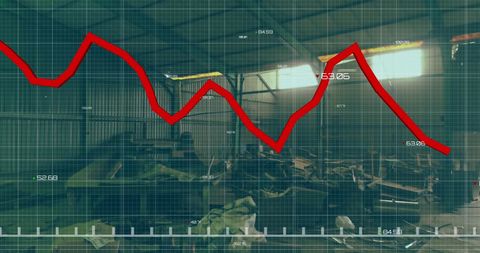
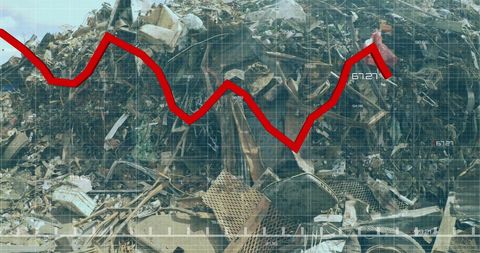
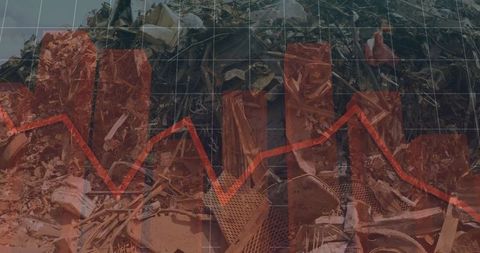
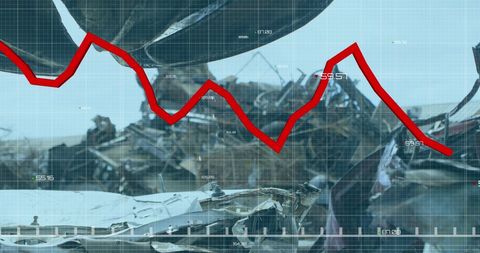
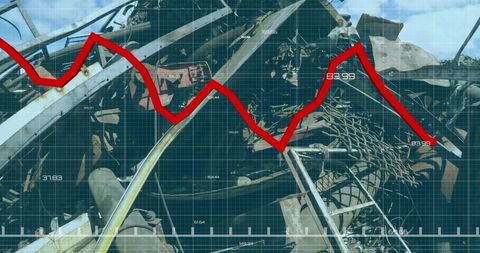
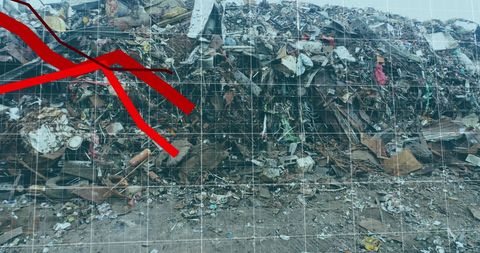
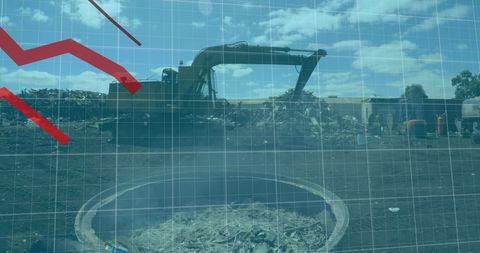
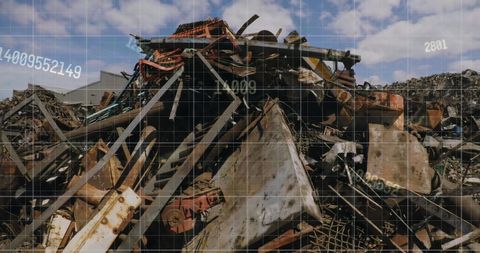
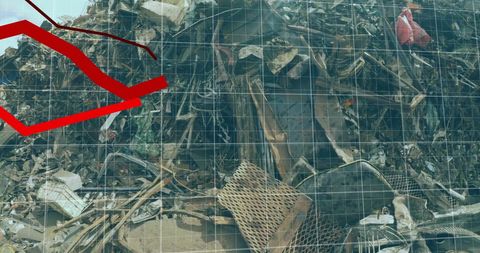
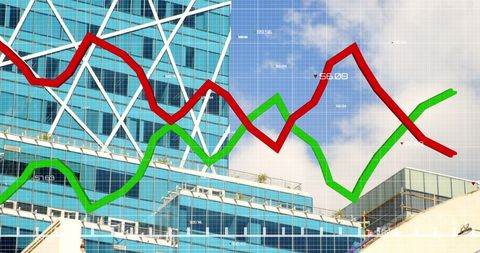
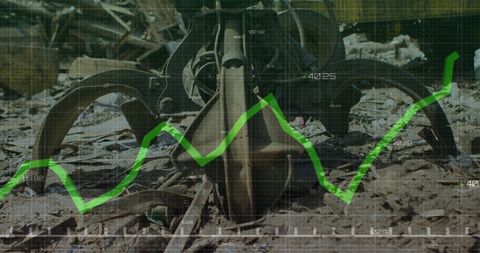
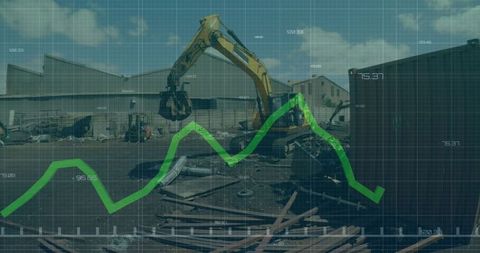
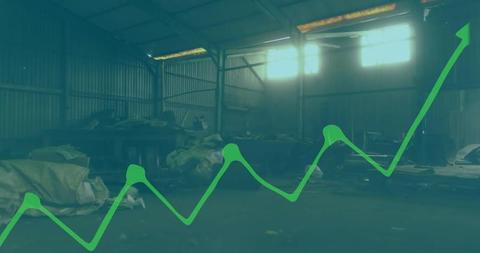
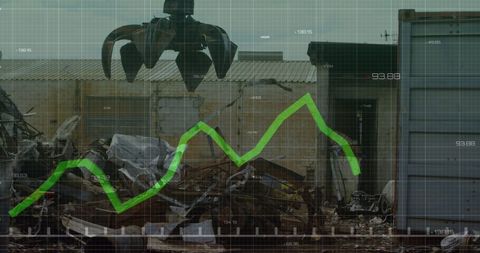
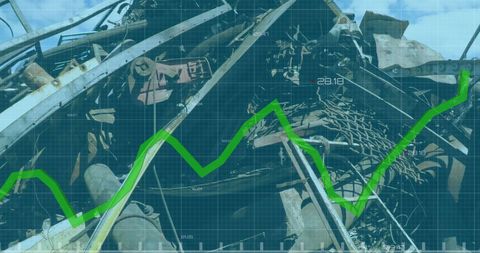
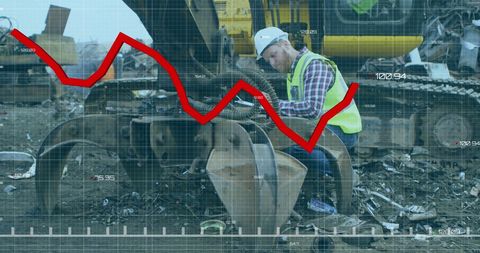
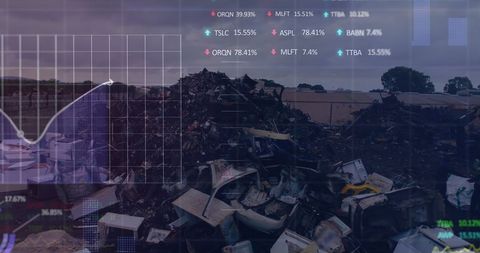
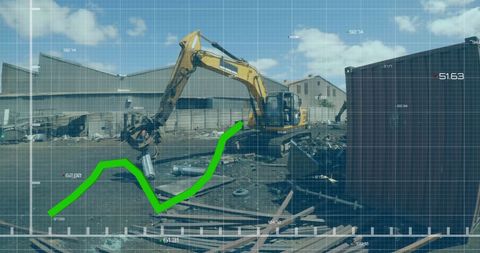
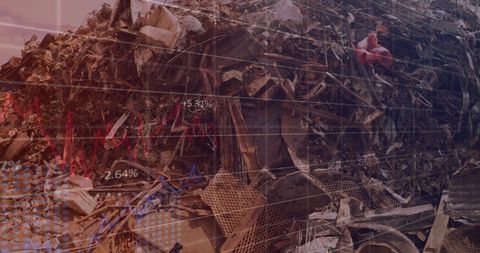
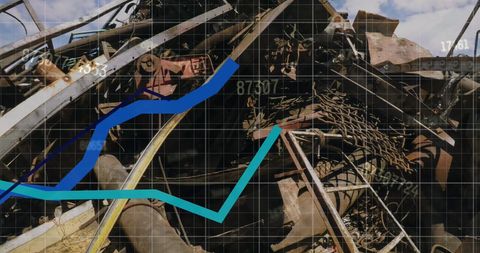
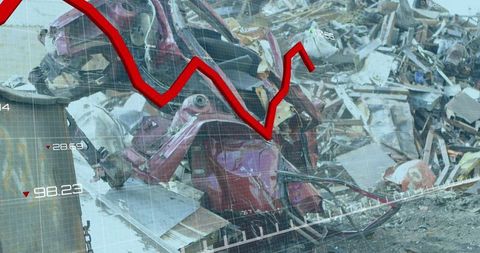
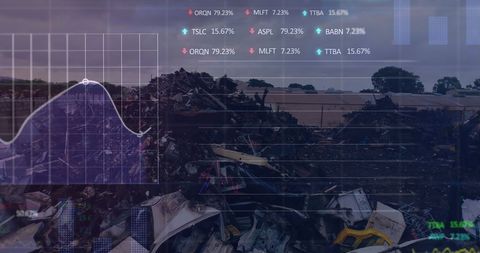
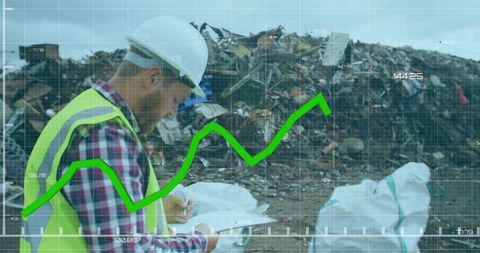
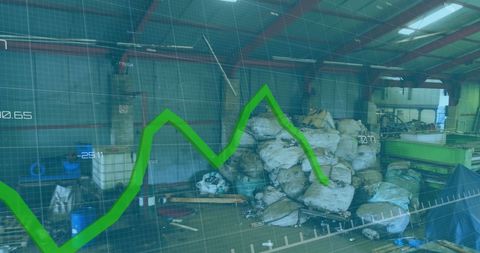
- Rusty Metal Scrap Yard with Declining Economic Graph Overlay
Rusty Metal Scrap Yard with Declining Economic Graph Overlay Image
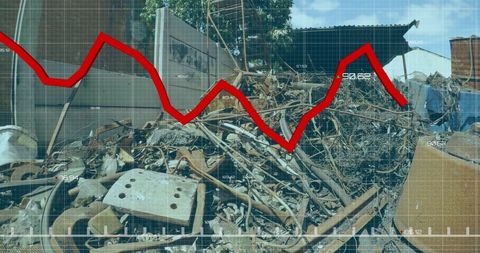
This is suitable for illustrating concepts related to economic decline or industrial challenges. It combines elements of financial data with a visual backdrop of industrial waste, making it applicable for use in reports, articles about economic setbacks, industry-specific analyses, or presentations addressing environmental impacts on the economy.

downloads
Tags:
More
Credit Photo
If you would like to credit the Photo, here are some ways you can do so
Text Link
photo Link
<span class="text-link">
<span>
<a target="_blank" href=https://pikwizard.com/photo/rusty-metal-scrap-yard-with-declining-economic-graph-overlay/e38b920e2c6d045ea1e499ecbbf43793/>PikWizard</a>
</span>
</span>
<span class="image-link">
<span
style="margin: 0 0 20px 0; display: inline-block; vertical-align: middle; width: 100%;"
>
<a
target="_blank"
href="https://pikwizard.com/photo/rusty-metal-scrap-yard-with-declining-economic-graph-overlay/e38b920e2c6d045ea1e499ecbbf43793/"
style="text-decoration: none; font-size: 10px; margin: 0;"
>
<img src="https://pikwizard.com/pw/medium/e38b920e2c6d045ea1e499ecbbf43793.jpg" style="margin: 0; width: 100%;" alt="" />
<p style="font-size: 12px; margin: 0;">PikWizard</p>
</a>
</span>
</span>
Free (free of charge)
Free for personal and commercial use.
Author: Creative Art