- Home >
- Stock Photos >
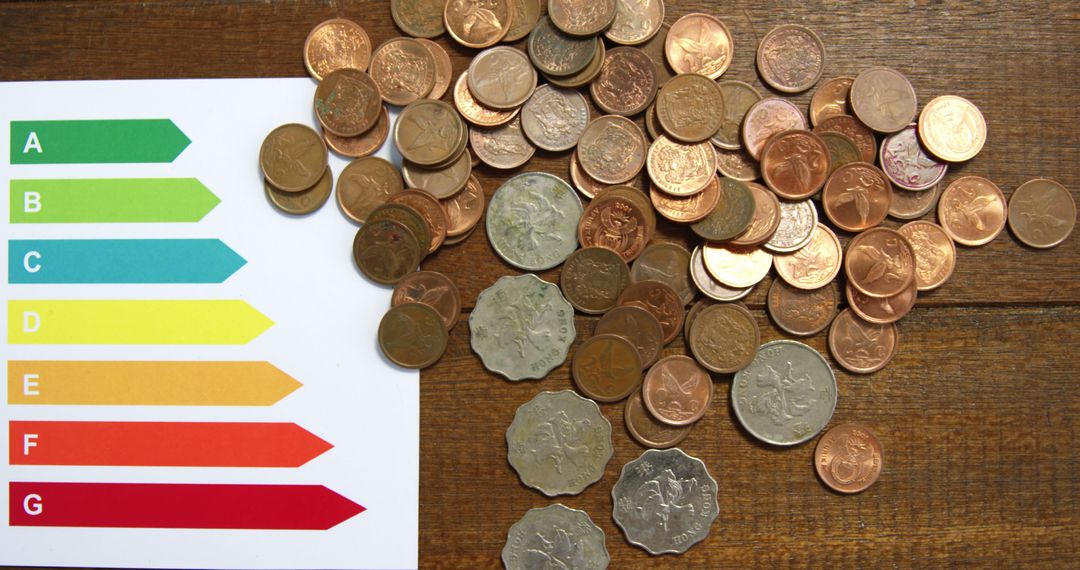
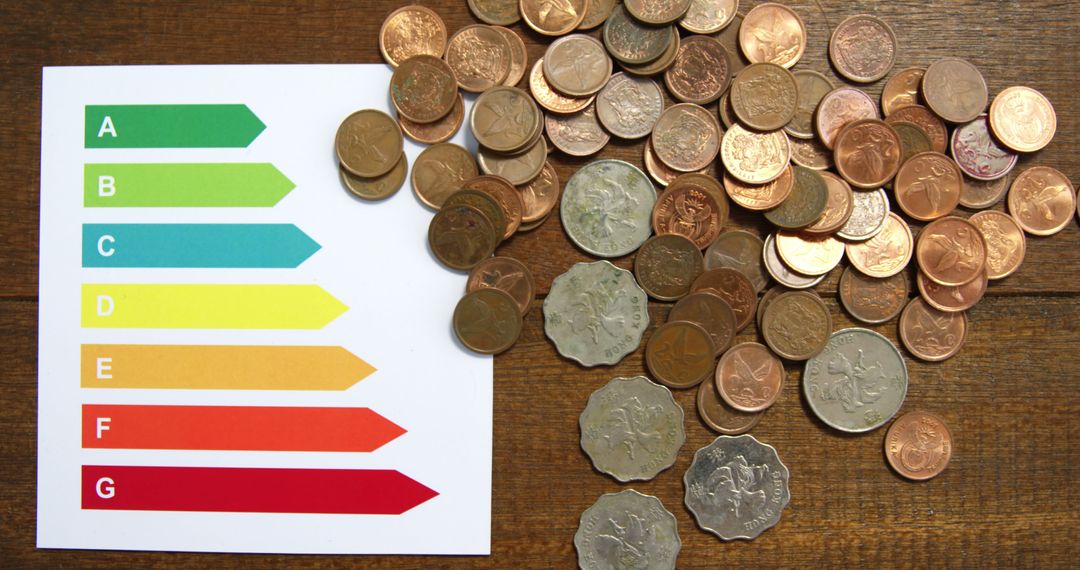
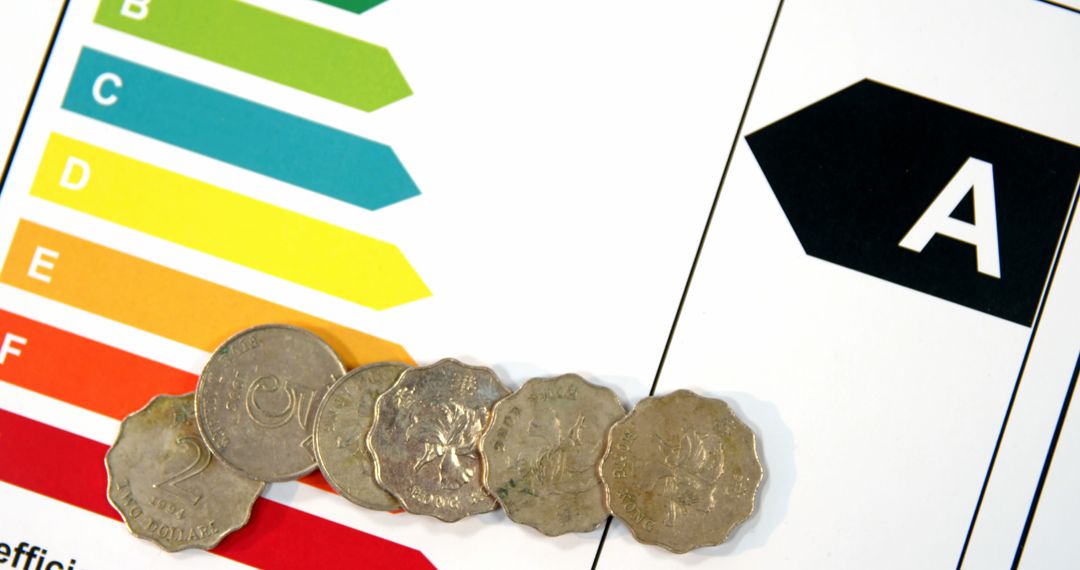
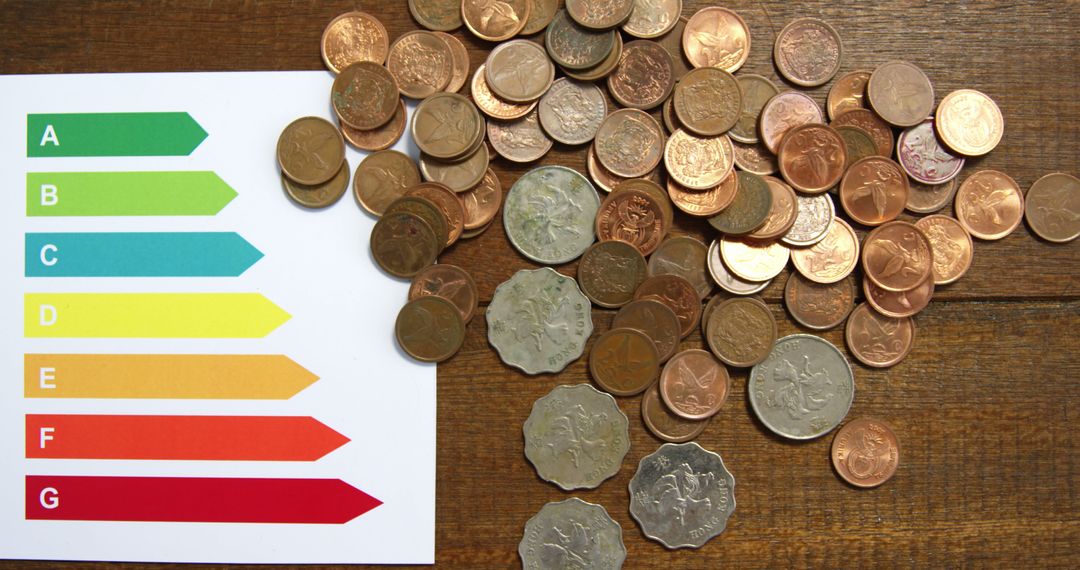
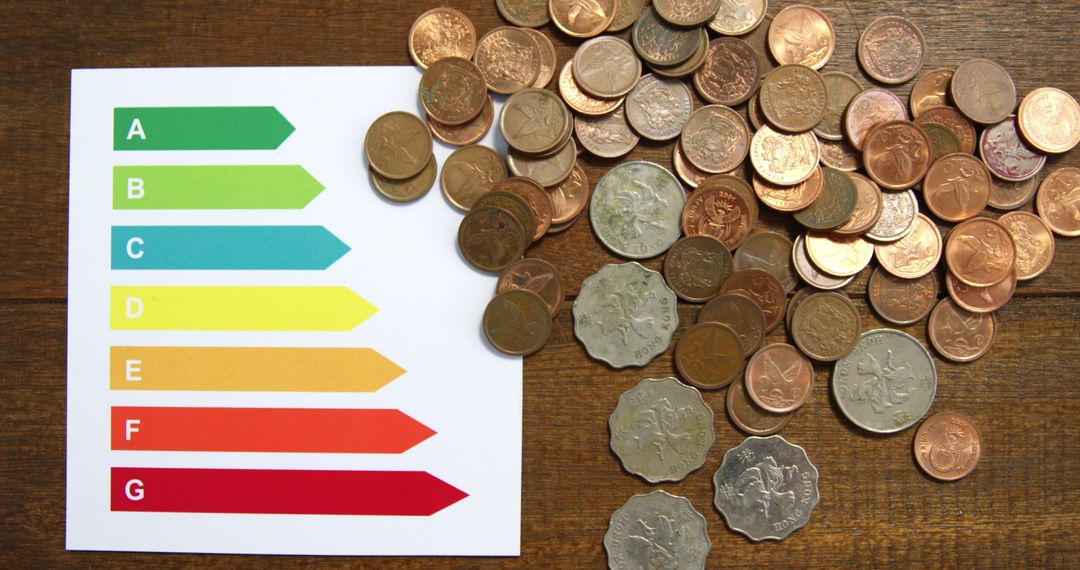
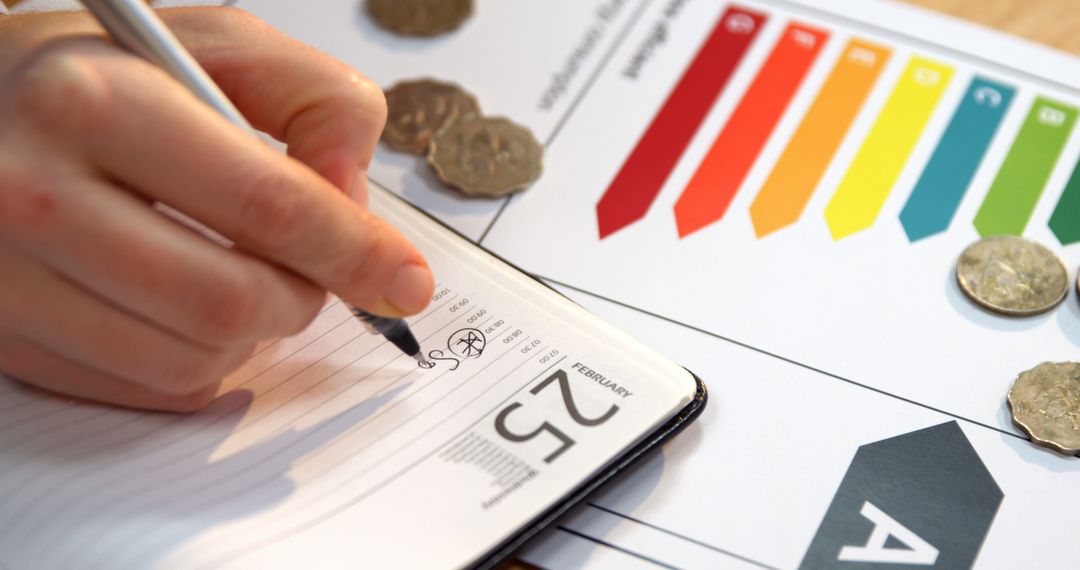
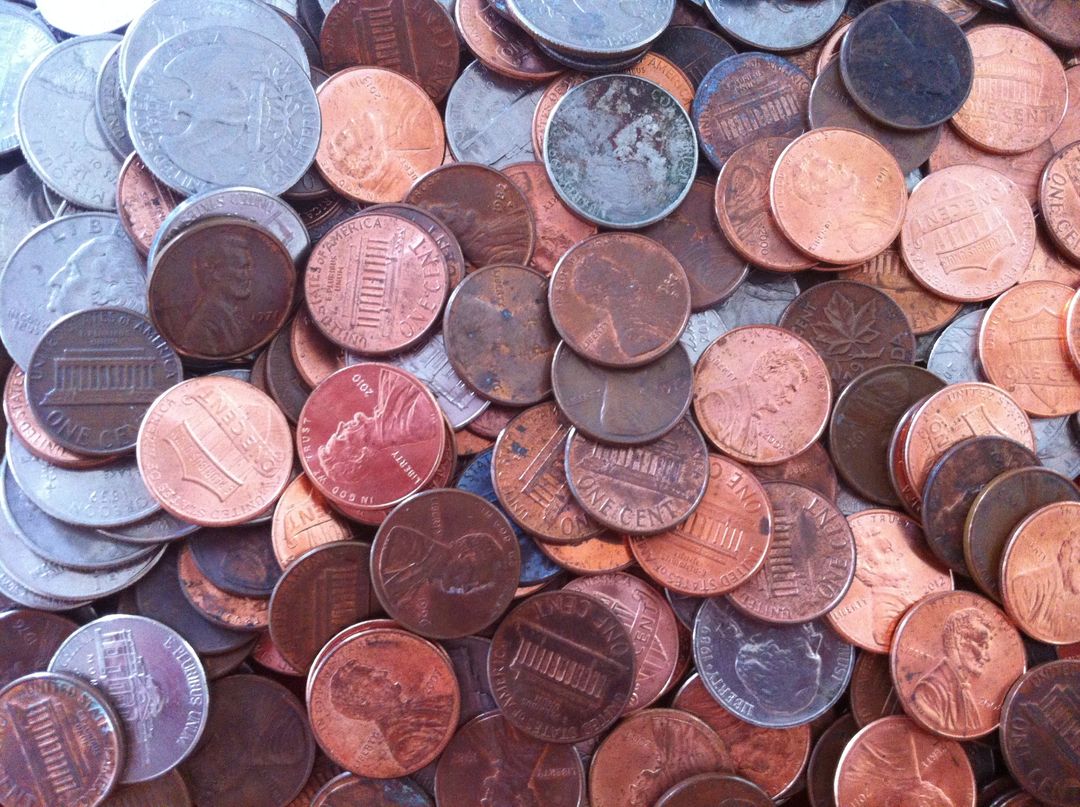
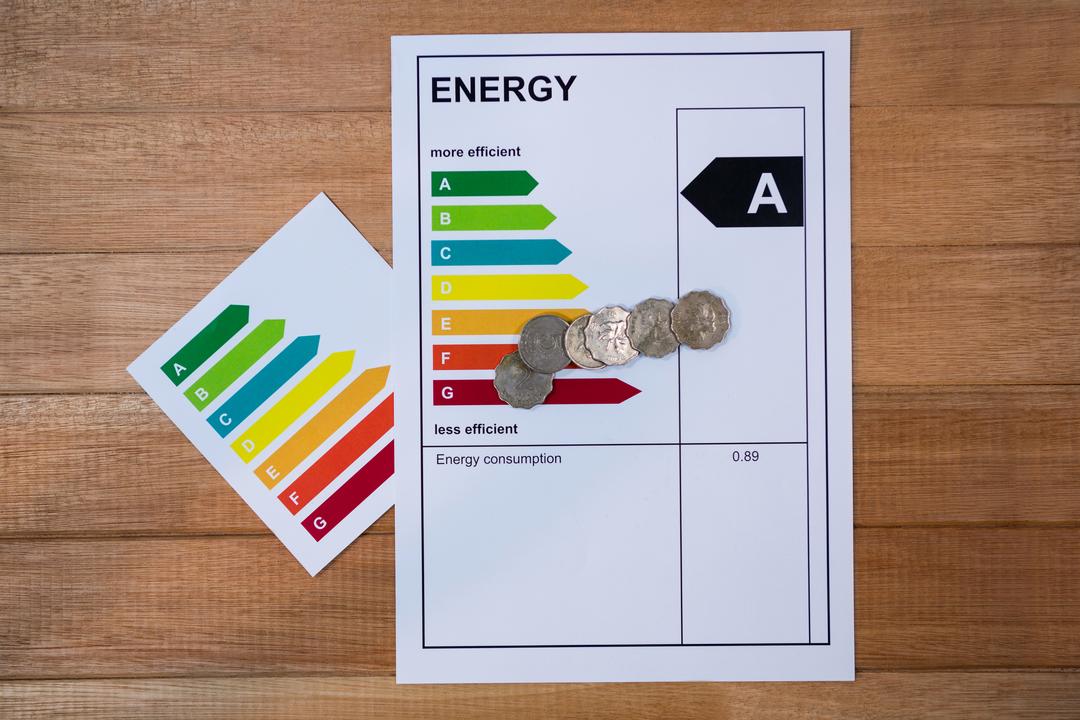
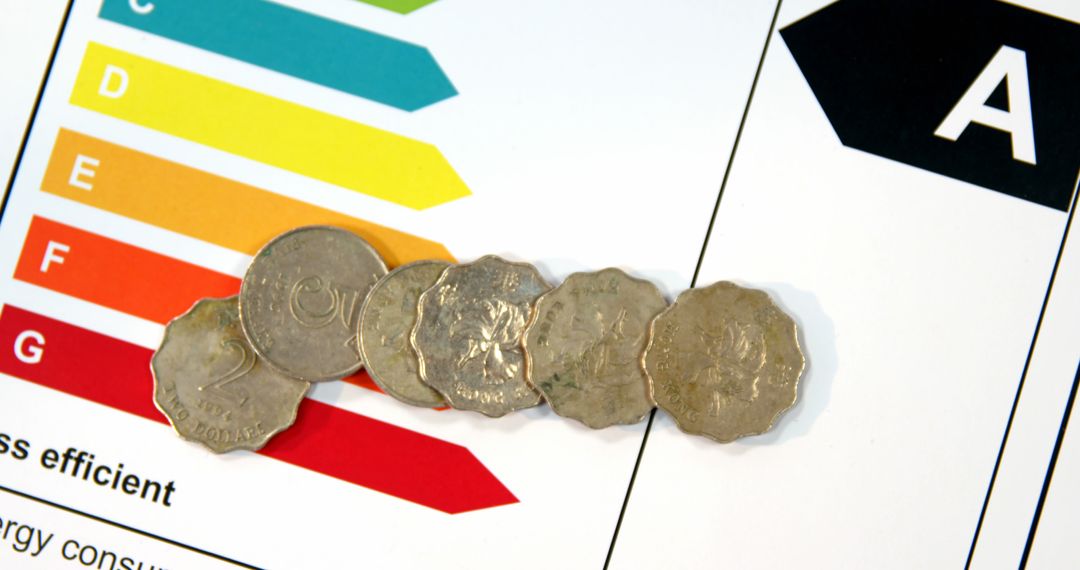
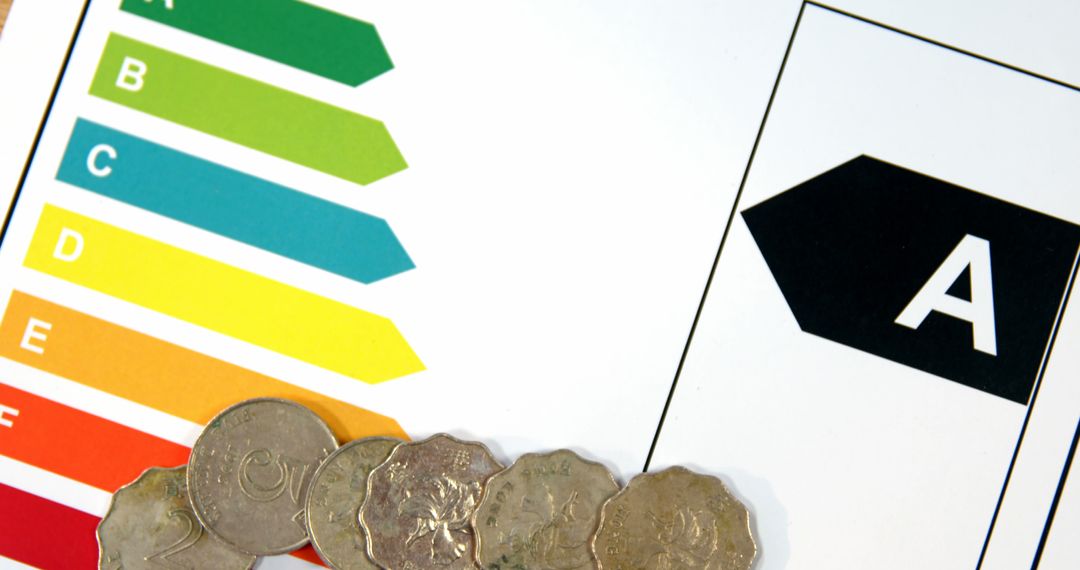
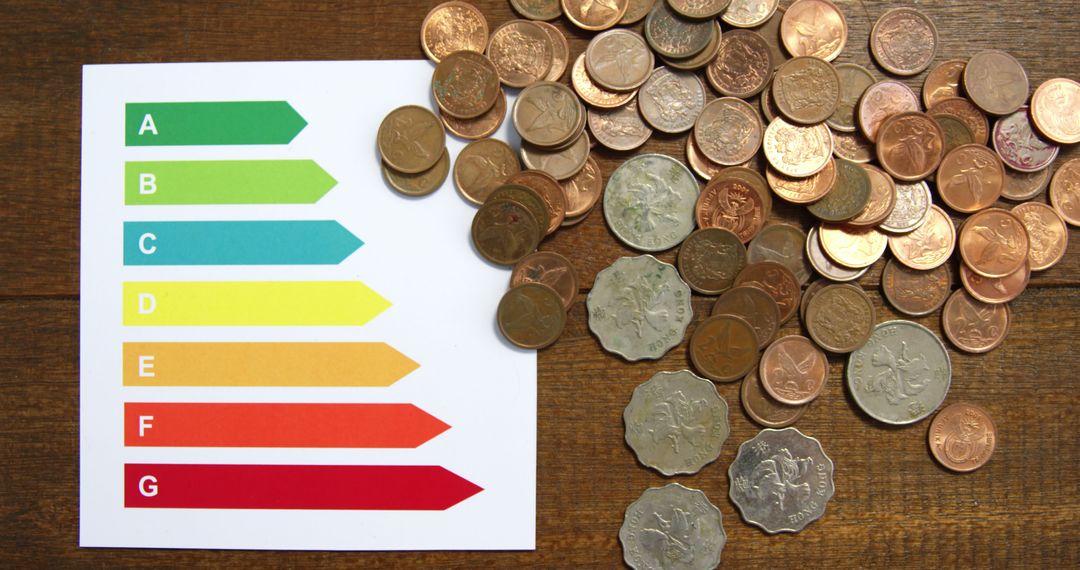
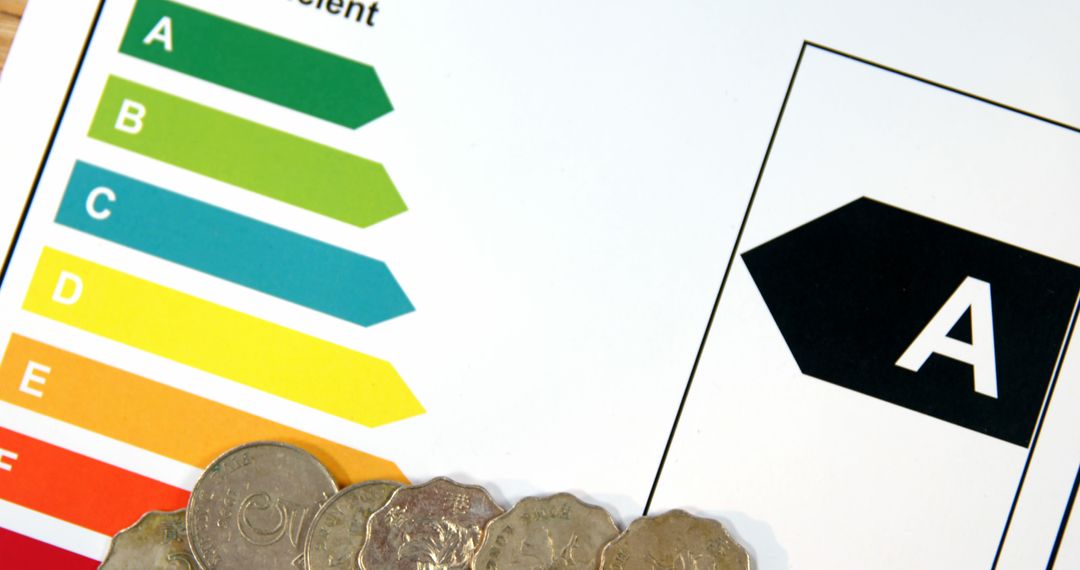
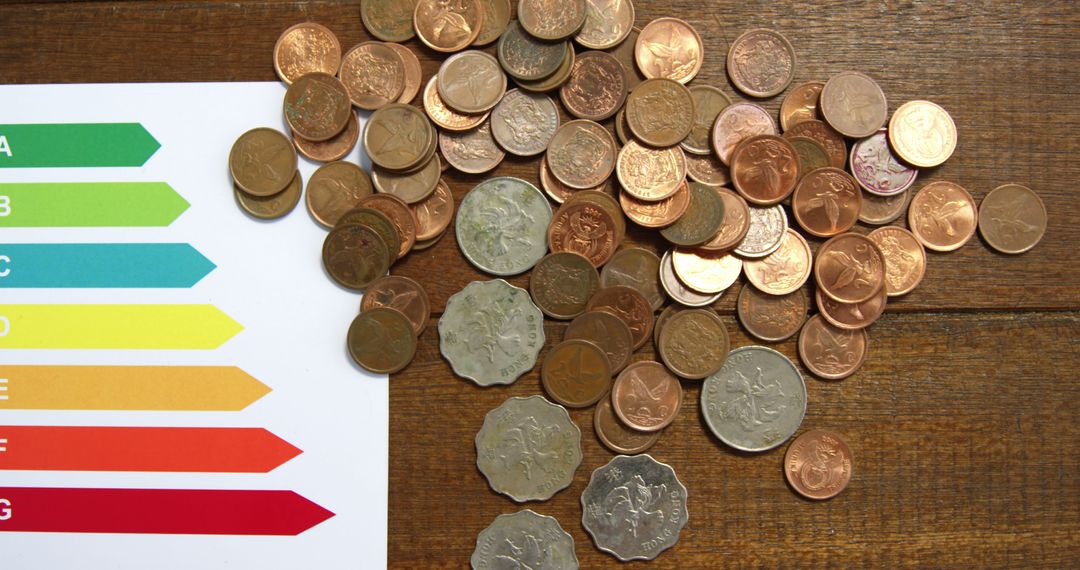
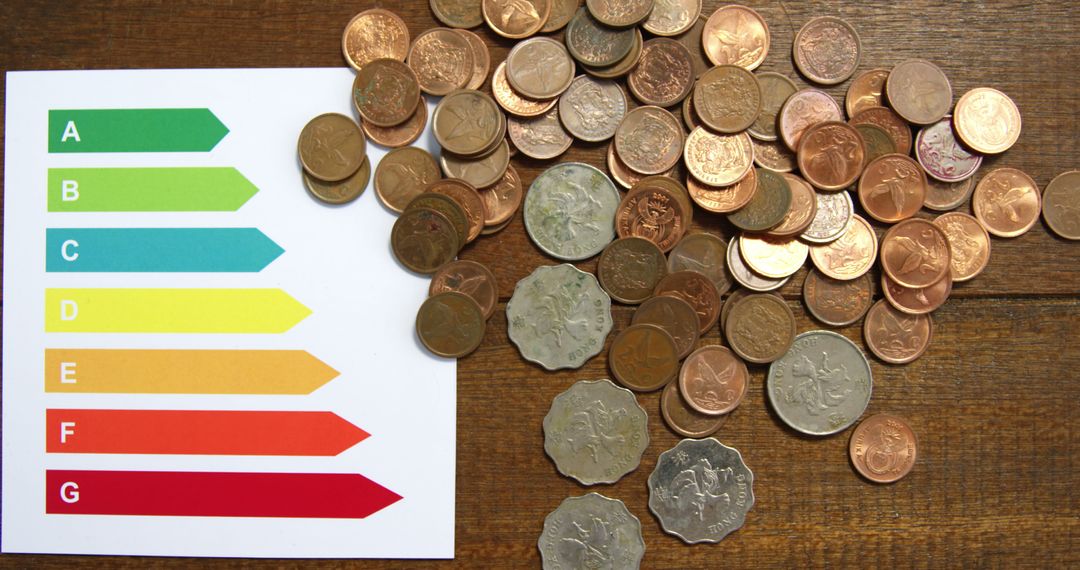
- Scattered Coins with Graph Chart on Table Symbolizing Financial Analysis
Scattered Coins with Graph Chart on Table Symbolizing Financial Analysis Image
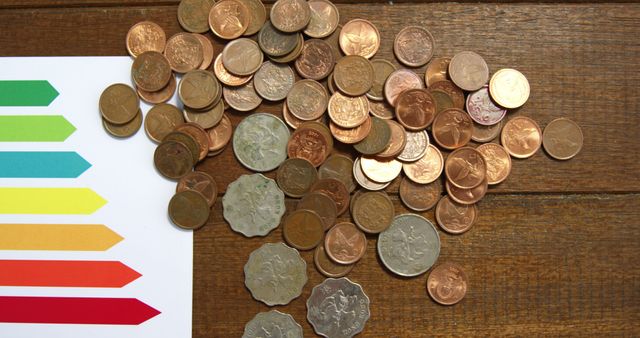
An assortment of coins lies next to a colorful graph chart, symbolizing various concepts related to personal finance, economics, savings strategies, and budgeting. This image is perfect for illustrating financial articles, blogs, or reports highlighting currency trends, investment planning, and economic analysis.
Powered by 


Credit Photo
If you would like to credit the Photo, here are some ways you can do so
Text Link
photo Link
<span class="text-link">
<span>
<a target="_blank" href=https://pikwizard.com/photo/scattered-coins-with-graph-chart-on-table-symbolizing-financial-analysis/0bc94658ed1467046fd29455dec4261a/>PikWizard</a>
</span>
</span>
<span class="image-link">
<span
style="margin: 0 0 20px 0; display: inline-block; vertical-align: middle; width: 100%;"
>
<a
target="_blank"
href="https://pikwizard.com/photo/scattered-coins-with-graph-chart-on-table-symbolizing-financial-analysis/0bc94658ed1467046fd29455dec4261a/"
style="text-decoration: none; font-size: 10px; margin: 0;"
>
<img src="https://pikwizard.com/pw/medium/0bc94658ed1467046fd29455dec4261a.jpg" style="margin: 0; width: 100%;" alt="" />
<p style="font-size: 12px; margin: 0;">PikWizard</p>
</a>
</span>
</span>
Free (free of charge)
Free for personal and commercial use.
Author: Authentic Images
Similar Free Stock Images

Premium


Premium


Premium


Premium


Premium


Premium


Premium


Premium


Premium


Premium


Premium


Premium


Premium


Premium


Premium


Premium


Premium


Premium


Premium


Premium


Premium

Premium


Premium


Premium